
General Information
Subject Area: Mathematics (B.E.S.T.)
Grade: 7
Strand: Data Analysis and Probability
Date Adopted or Revised: 08/20
Status: State Board Approved
Benchmark Instructional Guide
Connecting Benchmarks/Horizontal Alignment
Terms from the K-12 Glossary
- Event
- Theoretical Probability
Vertical Alignment
Previous Benchmarks
Next Benchmarks
Purpose and Instructional Strategies
In grade 7, students interpret the probability of a chance event and the likelihood of it occurring. In grade 8, students will solve problems involving probabilities related to single or repeated experiments, including making predictions based on theoretical probability.- An event is a set of outcomes.
- For example, if the experiment is to roll a six-sided die, possible events could be:
- “rolling a 3 or a 4;”
- “rolling an even number;” or
- “not rolling a 2.”
- For example, if the experiment is to roll a six-sided die, possible events could be:
- Instruction includes the understanding that some events can have a probability of 1 or 0. Students should understand that if an event has a probability of zero, the event is impossible or will not occur. If an event has a probability of one, the event is certain or must occur.
- For example, in the experiment of rolling a 6-sided die, the event of rolling a 1, 2, 3, 4, 5 or 6 would have a probability of 1.
- For example, when rolling a 6-sided fair die, the event of rolling a 7 would have a probability of 0.
- Instruction includes having students use probabilities of 1, 0.5 and 0 as benchmark probabilities to interpret the likelihood of other events.
- For example, if a student wants to interpret the likelihood represented by the probability of 80%, they can compare 80% to the benchmark probabilities of 50% and 100%.
- If an event has a probability of 0.5, it can be interpreted that is has the same likelihood as its opposite.
- For example, in the experiment of picking a card from a standard 52-card deck, the event of picking a red card has a probability of 0.5, which can be interpreted as having the same likelihood as the opposite event, which is picking a black card.
Common Misconceptions or Errors
- Students may invert the meaning of an event and an experiment.
- Students may confuse the mathematical meaning of a word like “event” with the everyday meaning.
- Students may incorrectly convert forms of probability between fractions and percentages. To address this misconception, scaffold with more familiar values initially to facilitate the interpretation.
- Students may incorrectly interpret a value with a negative sign as a possible probability.
- For example, − cannot represent a probability since negative values are less than 0.
Strategies to Support Tiered Instruction
- Teacher creates and posts an anchor chart with visual representations of probability terms to assist students in correct academic vocabulary when solving real-world problems.
- Teacher provides opportunities for students to use a 100 frame to review place value for and the connections to decimal, fractional and percentage forms of probabilities.
- Instruction includes the use of a 100 frame to review place value for tenths, hundredths, and if needed, thousandths and the connections for decimal and fractional forms of probabilities.
- When students incorrectly convert from one form to another (i.e, fraction to percentage), the teacher scaffolds with more familiar values initially to facilitate the interpretation.
Instructional Tasks
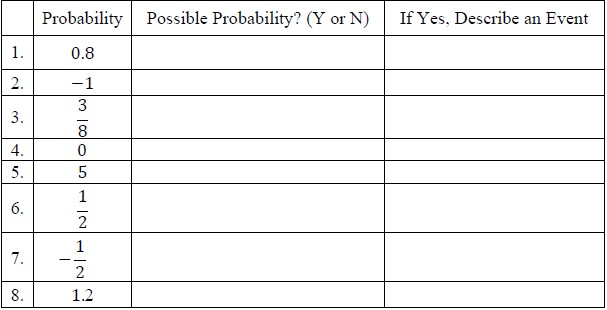
Instructional Task 1 (MTR.1.1)Determine which of the following could represent the probability of an event. For those that can, provide a possible event that would fit the probability given.
Instructional Items
Instructional Item 1In each scenario, a probability is given. Describe each event as likely, unlikely or neither.
- a. The probability of a hurricane being within 100 miles of a location in two days is 40%.
- b. The probability of a thunderstorm being located within 5 miles of your house sometime tomorrow is
- c. The probability of a given baseball player getting at least three hits in the game today is 0.08.
*The strategies, tasks and items included in the B1G-M are examples and should not be considered comprehensive.