
General Information
Subject Area: Mathematics (B.E.S.T.)
Grade: 7
Strand: Data Analysis and Probability
Date Adopted or Revised: 08/20
Status: State Board Approved
Benchmark Instructional Guide
Connecting Benchmarks/Horizontal Alignment
Terms from the K-12 Glossary
- Circle Graph
- Data
- Proportional Relationships
Vertical Alignment
Previous Benchmarks
Next Benchmarks
Purpose and Instructional Strategies
In grade 6, students worked with solving problems using ratio relationships. In grade 7, students apply their knowledge of ratios to solve problems involving proportions, including using proportional reasoning to construct, display and interpret categorical data in circle graphs. In high school, students will select an appropriate method to represent data, depending on whether it is numerical or categorical data and on whether it is univariate or bivariate.- Circle graphs can be used to show how categories represent part of a whole, or compositions. Totals are represented as percentages totaling 100%, which illustrates the percentage breakdown of items and visually represents a comparison. Circle graphs are not effective, however, when there are too many categories.
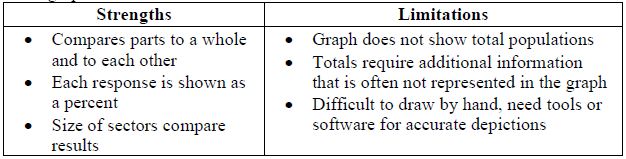
- Students should be able to identify strengths and limitations in showcasing data within a circle graph.
- Instruction begins with data sets out of 100 to allow for easier calculations of percentages.
- Students should brainstorm how they might split up their circle into the needed percentages (MTR.5.1).
- For example, students can slice a circle into 4 equal parts to show students the 4 right angles at the center which total 360°. Then emphasize using proportional relationships to determine the central angle sizes needed based on the percentage size of each “slice” of the circle.
- Students should collect their own data with which to create a circle graph (MTR.7.1).
- For example, have students count colored candy/snacks or survey other students in the room about their favorite color, favorite sport or favorite genre of music/movies.
- Use protractors or online software to assist in creating circle graphs accurately.
Common Misconceptions or Errors
- Students may incorrectly use the percent of a category for the central angle degrees instead of finding the degrees by using a proportion.
- Students may incorrectly round or make other errors in calculations that will lead to the circle graph sections not totaling 100%.
Strategies to Support Tiered Instruction
- Teacher models several examples to work through with students, showing how to set up the proportion to find the central angle degrees, referencing patterns for students to discuss.
- For example, if students need to determine the angle measure that corresponds to 21%, the proportion below can be used. =
- For example, if students need to determine the angle measure that corresponds to 21%, the proportion below can be used.
- Teacher models and works through several problems while discussing aloud how to properly round when having to total to 100%, reinforcing to students to work through the problems carefully as to not make computation errors.
- Teacher models using computer-based software to create circle graphs to verify how to properly round.
- Teacher provides students with fill in the blank examples working from percent of a category using proportions to find the central angle degrees.
- Teacher provides several completed examples of problems where rounding was needed for students to reference while working through multiple problems together.
- For students incorrectly using a protractor, provide students with a circle and allow them to measure sections then find the percent.
- Teacher models using fraction circle manipulatives to support converting fractions to percentages.
Instructional Tasks
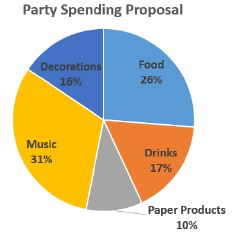
Instructional Task 1 (MTR.4.1, MTR.7.1)A group of friends has been given $800 to host a party. They must decide how much money will be spent on food, drinks, paper products, music and decorations.
- Part A. As a group, develop two options for the friends to choose from regarding how to spend their money. Decide how much to spend in each area and create a circle graph for each option to represent your choices.
- Part B. Mikel presented the circle graph below with his recommendations on how to spend the money. How much did he choose to spend on food and drinks? How much did he choose to spend on music?
Instructional Items
Instructional Item 1Circle Point High School surveyed its students to determine which mode of transportation they use to get to and from school. Create and label a circle graph based on the results given below.

*The strategies, tasks and items included in the B1G-M are examples and should not be considered comprehensive.