General Information
Benchmark Instructional Guide
Connecting Benchmarks/Horizontal Alignment
Terms from the K-12 Glossary
- Constant of Proportionality
- Proportional Relationships
Vertical Alignment
Previous Benchmarks
Next Benchmarks
Purpose and Instructional Strategies
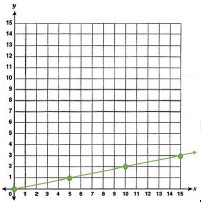
In grade 6, students solved problems involving ratios, rates and unit rates, including comparisons, mixtures, ratios of lengths and conversions within the same measurement system. In grades 7, students work with proportional relationships between two variables, and in grade 8, they will work with linear relationships.- Instruction includes different ways of representing proportional relationships, such as tables and graphs. Multiplying or dividing one quantity in a ratio by a particular factor requires doing the same with the other quantity in the ratio to maintain the proportional relationship. Graphing equivalent ratios create a straight line passing through the origin.
- Tables

- Graphs

- Tables
- Instruction allows time for students to analyze real-world situations to determine if quantities are in proportional relationships (MTR.7.1).
- Instruction includes the connection between ratios and the constant of proportionality (MA.7.AR.4.2) as a method to determine whether a relationship is proportional or not. Determining the constant of proportionality may be helpful when given a table.
- Instruction builds on students’ knowledge of unit rates and equivalent fractions to determine this constant (MTR.5.1).
- Compare various representations of the same relationship for students to make comparisons and identify patterns. This should include both proportional and non-proportional relationships for compare and contrast discussions (MTR.4.1).
Common Misconceptions or Errors
- Using cross products as a strategy to test for equivalent ratios may lead to errors and misconceptions solving more complex equations in the future. To address this misconception, instruction focuses on testing equivalent ratios using tables or graphs to ensure students understand that two quantities are proportional to each other when each quantity in a ratio, multiplied by a constant, gives the corresponding quantity in the second ratio (MTR.3.1).
- For example, provide students with the relationship between feet and yards. Students can discuss how the relationship 6 feet = 2 yards connects to the relationship 1.5 feet = 0.5 yard.
- Students may incorrectly believe the relationship is not proportional if the origin is not visible in the graph or given in the table. Help students extend the graph or table, using the pattern between points, until it reaches the origin.
- Students may incorrectly believe all graphs that are straight lines represent proportional relationships. To address this misconception, instruction focuses on the understanding that proportional relationships have a constant ratio between the two coordinates of each point and pass through the origin.
- Students reverse the position of the variables when writing equations. Students may find it useful to use letters for the variables that are specifically related to the quantities.
- Students may neglect to test all values when given a table.
Strategies to Support Tiered Instruction
- Teacher provides students with examples and non-examples of proportional relationships in a table, a graph and a verbal description. Teacher provides instructions for students to understand the patterns in proportional and non-proportional relationships.
- Instruction includes determining the value of when the -value is zero to determine if the table is proportional.
- Instruction includes determining the ratio for each value of and in a table to ensure all values have the same ratio.
- Teacher reminds students to use their knowledge of unit rates or equivalent fractions to find the pattern and extend the graph to determine if the graph is proportional.
- Teacher co-constructs a graphic organizer with examples and non-examples of proportional relationships in a table, graph and verbal description for students to compare and identify patterns in proportional and non-proportional relationships.
- Instruction includes the use of geometric software to represent proportional and non-proportional graphs to visually compare the models and clear the misconception that all linear graphs represent a proportional relationship.
- Instruction focuses on the understanding that proportional relationships have a constant ratio between the two coordinates of each point and pass through the origin.
- Instruction includes using the pattern between points to extend the graph or table until it reaches the origin.
- Teacher models how to use letters for the variables that are specifically related to the quantities.
- For example, use for tacos, or for mice.
Instructional Tasks
Instructional Task 1 (MTR.4.1, MTR.7.1)Johnny and Eleanor went to their local gas station to collect information about the cost of fuel for compact cars. They observed both regular and premium gas purchases that day and recorded their data in the table below.

- Part A. Is there a proportional relationship between the number of gallons of gas sold and the cost? Explain your answer.
- Part B. If the relationship is not proportional, which data value or values should be changed to make the relationship proportional? What could explain this difference?
Instructional Items
Instructional Item 1Angela is training for a marathon and completes her long mileage runs for training on the weekend. Over the last 3 weekends she ran 15 miles in 2 hours; 18 miles in 2 hours, 33 minutes; and 22 miles in 3 hours, 7 minutes. Determine if her weekend training runs showcase a proportional relationship.
*The strategies, tasks and items included in the B1G-M are examples and should not be considered comprehensive.
