
 which is equivalent to
  of an inch. This mean would be the same if it rained
 General Information
Benchmark Instructional Guide
Connecting Benchmarks/Horizontal Alignment
Terms from the K-12 Glossary
- Line Plots
- Mean
- Median
- Mode
- Range
Vertical Alignment
Previous Benchmarks
Next Benchmarks
Purpose and Instructional Strategies
The purpose of this benchmark is to interpret numerical data by using the mean, mode, median and range. This work builds on the previous understanding of mode, median, and range in Grade 4 (MA.4.DP.1.2). In Grade 6, a focus will be on comparing the advantages and disadvantages of the mean and median.- When finding median and mode, it is important for students to organize their data, putting it in order from least to greatest.
- With the data organized, students can determine:
- range by subtracting the least value from the greatest value in the set.
- mode by finding the value that occurs most often.
- median by finding the value in middle of the set.
- mean by finding the average of the set of numbers.
Common Misconceptions or Errors
- Students may confuse the mean and median of a data set. During instruction, teachers should provide students with examples where the median and mean of a data set are not close in value.
Strategies to Support Tiered Instruction
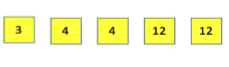
- Instruction includes examples where the mean and the median are not close in value and uses a data set to explain the difference between mean and median.
- For example, the data set shown has a median of 4 and a mean of 7. The teacher uses the data to model how the mean is calculated and how the median is found.
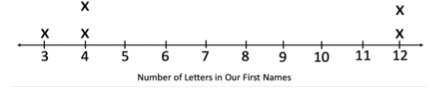
- Instruction includes writing the data on index cards or sticky notes. Students can then easily arrange the data in order from least to greatest. This will assist in finding the median of the data set.
- For example, students use the data shown to explain the difference between mean (which is 7) and median (which is 4) and to model how the mean is calculated and how the median is found.
Instructional Tasks
Instructional Task 1 (MTR.7.1)
Bobbie is a fifth grader who competes in the 100-meter hurdles. In her 8 track meets during the season, she recorded the following times to the nearest second.
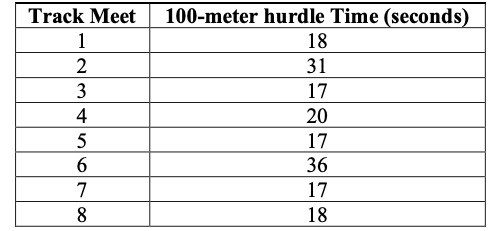
- Part A. What is the mean time, in seconds, of Bobbie’s 100-meter hurdles?
- Part B. What is the median time, in seconds, of Bobbie’s 100-meter hurdles?
- Part C. What is the mode time, in seconds, of Bobbie’s 100-meter hurdles?
- Part D. If you were Bobbie, which of these results would you report to your friend?
Instructional Task 2
Create a table using the data below.
Andrew has a 400-acre piece of land.
He monitors the deer population on the land.
In 2015 he counted 100 deer, 125 in 2016, 250 in 2017, and 150 in 2018.In 2019 he counted 200, 225 in 2020, 350 in 2021, and 250 in 2022.
Part A. What patterns do you see in the population of deer as years increase?
Part B. What predictions can you make about deer populations in 2023-2026?
Part C. Find the mean, median, mode, and range of the deer population from 2015-2022.
Instructional Task 3
Diego is collecting boxes for a science experiment. The volume of the boxes, in cubic inches, is shown in the table below.
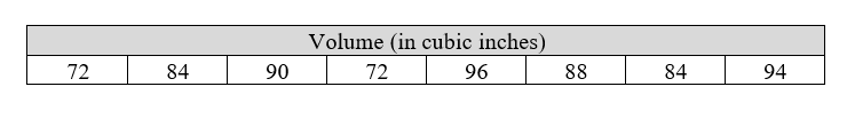
Part A. Find the mean, median, mode and range for the data set.
Part B. How will the mean, median, and mode for the data set change if Diego adds two more boxes that have a volume of 72 cubic inches?
Instructional Items
Instructional Item 1
There was a pie-eating contest at the county fair. The line plot below shows the number of pies each of the 10 contestants ate. Use the line plot to determine the mean, mode, median and range of the data.
![]()
Instructional Item 2
Ada was given a Smart Watch as a gift.
She used the watch to monitor how much time she spent walking during the day.
She recorded her total minutes each day for eleven days.
Walking Minutes Recorded by Smart Watch Daily

Use the data set above to find the following.
Mean _________
Median _________
Mode _________
Range _________
Instructional Item 3
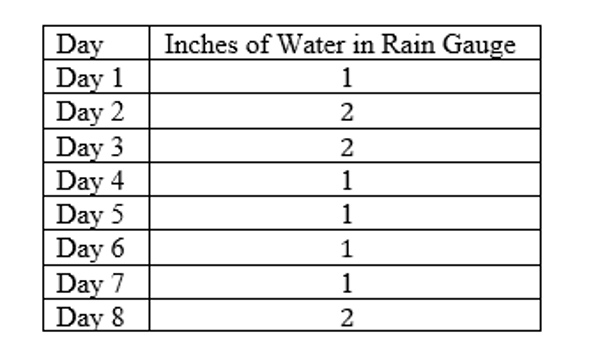
Sam was collecting water in a rain gauge as part of a science experiment.
He collected water for eight days, the data is below.
Create a line plot of the data, including appropriate labels.
Instructional Item 4
The line plot shows the number of minutes Teia read each day for the past 10 days.
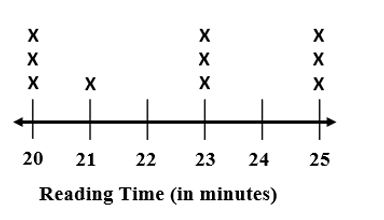
Part A. What is the mean of the data set?
Part B. Which statement correctly describes the data set?
a. The mode for the data set is 23.
b. The difference of the range and median is 18.
c. The range of the data set is greater than the median.
d. The difference of the range and median is 23.
*The strategies, tasks and items included in the B1G-M are examples and should not be considered comprehensive.