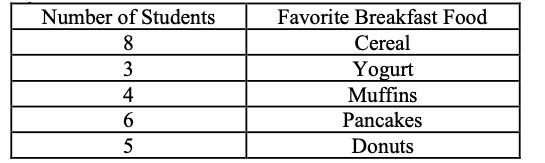
Collect, categorize and represent data using tally marks, tables, pictographs or bar graphs. Use appropriate titles, labels and units.
Data displays can be represented both horizontally and vertically. Scales on graphs are limited to ones, fives or tens.
| Name |
Description |
| How does Generative AI work? | Students will explore Artificial Intelligence (AI) and the basics on how generative AI models use Large Language Models (LLMs) and Natural Language Processing NLP to generate outputs. This K-3 lesson is an integrated Computer Science, ELA and Math lesson designed for application of math and ELA content knowledge while exploring and using computational thinking to understand how generative AI works, making cross-curricular connections to understand emerging technologies. |
| Exploring Machine Learning to Train an AI Model | Students will explore Artificial Intelligence (AI) and Machine Learning (ML) and pretrain a model to recognize and identify objects, including geometric shapes and aircraft. They will used unplugged activities to mimic sorting and classification of the objects using their prior knowledge and then make connections to human learning and Machine Learning. Students will then problem solve and propose solutions using an iterative process to improve the ML model to better recognize the objects. This lesson is an integrated Computer Science, Science and Math lesson designed for students in K-2 to apply math and science content knowledge while exploring and using computational thinking like people in Computer Science careers do. |
| COUNTING ON RESPONSIBLE CITIZENSHIP (Lesson 3 of 3) | In this math/civics lesson integrated lesson students will create a pictograph based on data collected from 3 short stories realted to ressponisble and irrsponsible citizenship.
|
| Counting on Responsible Citizenship Lesson 2 of 3 | In this math/civics integrated lesson students will categorize a list of 35 responsible citizenship descriptions into 3 categories found within a school/classroom community. Students will create a tally table to represent the data.
|
| Counting on Responsible Citizenship (Lesson 1 of 3) | In this math/civics integrated lesson students will categorize responsible and irresponsible citizen characteristics and create a bar graph using titles, labels, and units (also known as scale). |
| Water: Responsible Citizens Conserve Water | Students will learn and apply knowledge relating to water’s three main states of matter and how responsible citizenship includes the responsible use of water in this integrated lesson plan. |
| Taking Flight | Students will explore airplanes in this project-based lesson/unit with multiple lessons that are all tied to a final project. |
| What Goes Up Must Come Down! | This is a second grade science lesson that incorporates math, science, and engineering as students work in collaborative groups to investigate gravity using real-world situations.
Students will investigate the following problem:
How can you design an invention that keeps a balloon in the air instead of letting it be pulled to the ground by gravity? Can you keep your balloon in the air longer than the other teams? |
| Bar Graph Exploration | Here's a great introductory lesson to explore creating bar graphs with your students! Students will learn to create vertical bar graphs with a single unit scale using a variety of manipulatives and answer one-step comparison and put together questions using their data displays. |
| Graphing Fun | This lesson incorporates collecting, categorizing, and representing data using pictographs and bar graphs. Students will also interpret data represented in these graphs including solving problems. The story Sir Cumference and the Off the Charts Dessert by Cindy Neuschwander is used to interest students in graphing and presents a good opportunity to set up an independent practice activity for students. |
| How Much Do We Need to Order? | Students are provided the task of determining the total number of students in Kindergarten, first, and second grades in their school. Students will develop a plan to collect the information. Students will create a table to represent the data and find the total number of students. |
| Gummy Graphing | Students will make bar graphs using gummy bears and Skittles! |
| Pop, Pop, Pop! | Students will research the effects of sugary drinks on their health. They will interpret data on a variety of beverages presented in the form of bar graphs and decide which beverages should be included in school vending machines to ensure students have healthy drink options. |
| Setting the Bar: Representing Data Sets | In this lesson, students will use data from an in-class survey, animal pictures, and manipulatives to categorize and display in bar graphs. Students use the graphs to solve addition and subtraction problems about the data. |
| Saving Seabirds | In this Model Eliciting Activity, MEA, students will make decisions that focus on what and how human activities may impact ocean life and what actions students may take in protecting our ocean. The Supplemental Reading passage serves as a springboard to elicit students understanding of real issues around them.
Model Eliciting Activities, MEAs, are open-ended, interdisciplinary problem-solving activities that are meant to reveal students’ thinking about the concepts embedded in realistic situations. MEAs resemble engineering problems and encourage students to create solutions in the form of mathematical and scientific models. Students work in teams to apply their knowledge of science and mathematics to solve an open-ended problem, while considering constraints and tradeoffs. Students integrate their ELA skills into MEAs as they are asked to clearly document their thought process. MEAs follow a problem-based, student centered approach to learning, where students are encouraged to grapple with the problem while the teacher acts as a facilitator. To learn more about MEA’s visit: https://www.cpalms.org/cpalms/mea.aspx |
| The Perils of a Plant: Watering Can - An Engineering Design Challenge | This Engineering Design Challenge is intended to help students apply the concepts of life cycles, the understanding that all living things have basic needs, a knowledge of habitats and practice working with money as they build and experiment with containers to meet the water needs of bean plants in all stages of their life cycle. It is not intended as an initial introduction to these concepts. |
| Tadpole Habitat - An Engineering Design Challenge | This engineering design challenge is intended to help students apply the concepts of life cycles, the understanding that all living things have basic needs, build on their knowledge of habitats, and practice working with money as they build structures to meet the needs of a tadpole. It is not intended as an initial introduction to these concepts. |
| South of the Border with Borreguita: An Engineering Design Challenge | This is an integrated lesson that includes an Engineering Design Challenge, a study of Mexico using an informational text, and a traditional folktale, Borreguita and the Coyote by Verna Aardema. The Engineering Design Challenge is intended to help students investigate and generate explanations and practice working with money as they design and build flagpoles to display a flag representing story concepts. It is not intended as an initial introduction to these concepts. |
| Water Parks Galore! | In this Model Eliciting Activity, MEA, students will devise a procedure, and justify it, in order to determine the best features of a water park. Students will use problem-solving skills and data sets presented in a bar graph and table. In a “twist,” students will be given new information and asked to determine whether their procedure still works. Students will create a bar graph representing the new data.
Model Eliciting Activities, MEAs, are open-ended, interdisciplinary problem-solving activities that are meant to reveal students’ thinking about the concepts embedded in realistic situations. MEAs resemble engineering problems and encourage students to create solutions in the form of mathematical and scientific models. Students work in teams to apply their knowledge of science and mathematics to solve an open-ended problem, while considering constraints and tradeoffs. Students integrate their ELA skills into MEAs as they are asked to clearly document their thought process. MEAs follow a problem-based, student centered approach to learning, where students are encouraged to grapple with the problem while the teacher acts as a facilitator. To learn more about MEA’s visit: https://www.cpalms.org/cpalms/mea.aspx |
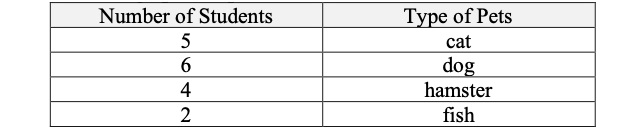
| Class Pets | In this Model Eliciting Activity, MEA, students will devise a plan for ranking, and justify it, in order to choose the best class pet. Students will use problem-solving skills, interpret data presented in tables, add two-digit numbers, compare two and three-digit numbers, and create bar graphs.
Model Eliciting Activities, MEAs, are open-ended, interdisciplinary problem-solving activities that are meant to reveal students’ thinking about the concepts embedded in realistic situations. MEAs resemble engineering problems and encourage students to create solutions in the form of mathematical and scientific models. Students work in teams to apply their knowledge of science and mathematics to solve an open-ended problem, while considering constraints and tradeoffs. Students integrate their ELA skills into MEAs as they are asked to clearly document their thought process. MEAs follow a problem-based, student centered approach to learning, where students are encouraged to grapple with the problem while the teacher acts as a facilitator. To learn more about MEA’s visit: https://www.cpalms.org/cpalms/mea.aspx |
| Three Pigs 2.0 - An Engineering Design Challenge | This Engineering Design Challenge is intended to help students apply the concepts of force from SC.2.P.13.1 (investigate the effect of applying various pushes and pulls on different objects) and the concept of wind from SC.2.E.7.4 (investigate that air is all around us and that moving air is wind) as they build structures to withstand the force of high-speed winds. It is not intended as an initial introduction to these concepts. |
| Three Billy Goats Gruff Build a Bridge - An Engineering Design Challenge | This Engineering Design Challenge is intended to help students apply the concepts of force as they build bridges to hold the greatest load. It is also intended to help students apply the concepts of money as they strive to construct the most cost effective bridge. It is not intended as an initial introduction to these concepts. |
| Graphing Away | In this lesson, students will use a survey question of their choice to collect data and then represent the data on a bar graph with an appropriate title, labels, and a scale of one. Students will write statements to interpret their data. |
| Collecting Data Through the Holidays | This lesson focuses on the use of tally charts, numerical tables, and bar graphs to collect, categorize, and represent data using holiday-based surveys. Students will find out who collected candy on Halloween, who ate corn on Thanksgiving, who left cookies for Santa on Christmas, etc. Teachers will make up their own questions to make the data collection relevant to their class. |
| Representing and Interpreting Data in a Bar Graph | Students will collect data and represent it using a bar graph with an appropriate title, labels, and scale of one. Students will interpret data by solving simple comparison problems using information presented in a bar graph. |
| Fitness Frenzy | In this lesson, students will interpret data represented with tally marks, tables, pictographs, and bar graphs and represent data using pictographs and bar graphs with appropriate titles, labels and units. |
| Henry and Mudge Meet Leonardo da Vinci | This is an integrated lesson that includes an Engineering Design Challenge, a review of forces, an introduction to drawbridges, and a literary text Henry and Mudge and The Long Weekend by Cynthia Rylant. The Engineering Design Challenge is intended to help students investigate and generate explanations and practice working with money as they design and build movable drawbridges. It is not intended as an initial introduction to these concepts. |
| If the Shoe Fits... | In this lesson, students will create pictographs or bar graphs based on linear measurements that they collect while participating in the practice of scientific inquiry. |