Sample Test Item Preview


This document was generated on CPALMS - www.cpalms.org


General Information

Related Standards: MAFS.7.RP.1.2
Reporting Category: Ratios & Proportional Relationships
Type: GRID: Graphic Response Item Display
Difficulty: N/A
Question:
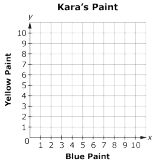
Kara is mixing paint. Each batch has twice as much blue paint as yellow paint.

Plot points to represent the amount of blue and yellow paint used in three different-sized batches.


Aligned Standards

Code Description
MAFS.7.RP.1.2: Recognize and represent proportional relationships between quantities.
  1. Decide whether two quantities are in a proportional relationship, e.g., by testing for equivalent ratios in a table or graphing on a coordinate plane and observing whether the graph is a straight line through the origin.
  2. Identify the constant of proportionality (unit rate) in tables, graphs, equations, diagrams, and verbal descriptions of proportional relationships.
  3. Represent proportional relationships by equations. For example, if total cost t is proportional to the number n of items purchased at a constant price p, the relationship between the total cost and the number of items can be expressed as t = pn.
  4. Explain what a point (x, y) on the graph of a proportional relationship means in terms of the situation, with special attention to the points (0, 0) and (1, r) where r is the unit rate.


Printed On:4/27/2024 7:19:18 AM
Print Page | Close this window