Sample Test Item Preview


This document was generated on CPALMS - www.cpalms.org


General Information

Related Standards: MAFS.6.SP.2.5
Reporting Category: Statistics & Probability
Type: EE: Equation Editor
Difficulty: N/A
Question:
A line plot shows the number of cans a class of students at Epping Middle School collected for a canned food drive.


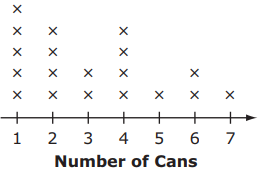
How many students collected cans of food?


Aligned Standards

Code Description
MAFS.6.SP.2.5: Summarize numerical data sets in relation to their context, such as by:
  1. Reporting the number of observations.
  2. Describing the nature of the attribute under investigation, including how it was measured and its units of measurement.
  3. Giving quantitative measures of center (median and/or mean) and variability (interquartile range and/or mean absolute deviation), as well as describing any overall pattern and any striking deviations from the overall pattern with reference to the context in which the data were gathered.
  4. Relating the choice of measures of center and variability to the shape of the data distribution and the context in which the data were gathered.


Printed On:4/27/2024 7:03:12 PM
Print Page | Close this window