Sample Test Item Preview


This document was generated on CPALMS - www.cpalms.org


General Information

Related Standards: MAFS.6.SP.1.3
Reporting Category: Statistics & Probability
Type: EE: Equation Editor
Difficulty: N/A
Question:
Tim drives the Grand Avenue bus route. The total number of people who ride the bus each week for 5 weeks is shown in the data table.


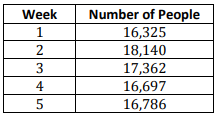
How many more people need to ride the bus in week 6 to increase the mean number of riders per week by 10?


Aligned Standards

Code Description
MAFS.6.SP.1.3: Recognize that a measure of center for a numerical data set summarizes all of its values with a single number, while a measure of variation describes how its values vary with a single number.


Printed On:4/28/2024 4:20:02 PM
Print Page | Close this window