Sample Test Item Preview


This document was generated on CPALMS - www.cpalms.org


General Information

Related Standards: MAFS.3.MD.2.3
Reporting Category: Measurement and Data
Type: MC: Multiple Choice
Difficulty: N/A
Question:

The graph shows the height of each tower that five students built for a social studies project.

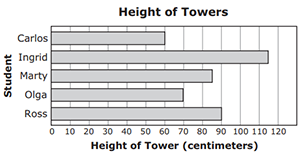
How many centimeters taller is the tower that Ross built than the tower that Carlos built?


Answer Options:

A. 20

B. 30

C. 90

D. 150


Aligned Standards

Code Description
MAFS.3.MD.2.3: Draw a scaled picture graph and a scaled bar graph to represent a data set with several categories. Solve one- and two-step “how many more” and “how many less” problems using information presented in scaled bar graphs. For example, draw a bar graph in which each square in the bar graph might represent 5 pets.


Printed On:4/29/2024 3:28:25 PM
Print Page | Close this window