Sample Test Item Preview


This document was generated on CPALMS - www.cpalms.org


General Information

Related Standards: MAFS.3.MD.2.3
Reporting Category: Measurement and Data
Type: EE: Equation Editor
Difficulty: N/A
Question:

John surveys his classmates about their favorite foods, as shown in the bar graph.

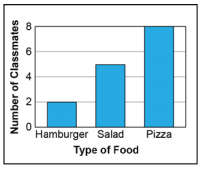
How many more classmates prefer pizza over salad?


Aligned Standards

Code Description
MAFS.3.MD.2.3: Draw a scaled picture graph and a scaled bar graph to represent a data set with several categories. Solve one- and two-step “how many more” and “how many less” problems using information presented in scaled bar graphs. For example, draw a bar graph in which each square in the bar graph might represent 5 pets.


Printed On:5/6/2024 7:32:32 AM
Print Page | Close this window