
General Information
Related Benchmarks:
MA.7.S.6.2
Reporting Category: Statistics
Type: MC: Multiple Choice
Difficulty: N/A
Question:
Television programs are separated into parts by commercials and network promotions. The circle graph below shows the percent of a 60-minute television show that is used for commercials, promotions, and the program itself.
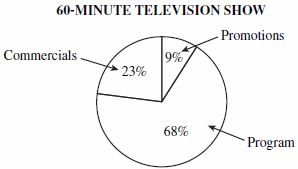
Which is closest to the number of minutes used for commercials and promotions during that 60-minute television show?
Answer Options:
A. 5
B. 14
C. 19
D. 32
B. 14
C. 19
D. 32
Answer Key:
C
Item Context:
The Arts