Sample Test Item Preview


This document was generated on CPALMS - www.cpalms.org


General Information

Related Standards: MAFS.8.SP.1.4
Reporting Category: Statistics & Probability
Type: EE: Equation Editor
Difficulty: N/A
Question:

Five hundred students were asked whether they prefer apple juice or orange juice. The table shown displays the results.

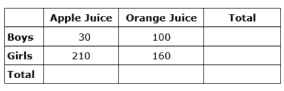
How many more girls were surveyed than boys?

Answer Key:
240

Aligned Standards

Code Description
MAFS.8.SP.1.4: Understand that patterns of association can also be seen in bivariate categorical data by displaying frequencies and relative frequencies in a two-way table. Construct and interpret a two-way table summarizing data on two categorical variables collected from the same subjects. Use relative frequencies calculated for rows or columns to describe possible association between the two variables. For example, collect data from students in your class on whether or not they have a curfew on school nights and whether or not they have assigned chores at home. Is there evidence that those who have a curfew also tend to have chores?


Printed On:5/3/2024 10:59:27 AM
Print Page | Close this window