Sample Test Item Preview


This document was generated on CPALMS - www.cpalms.org


General Information

Related Standards: MAFS.8.SP.1.1
Reporting Category: Statistics & Probability
Type: MC: Multiple Choice
Difficulty: N/A
Question:

A scatter plot is shown.

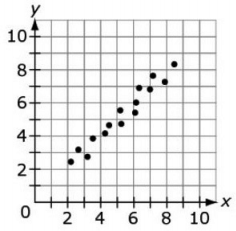
Which statement is true for the scatter plot?

Answer Options:

A. The data show no association.

B. The data show a positive correlation.

C. The data show a negative correlation.

D. The data show a nonlinear association.

Answer Key:
B

Aligned Standards

Code Description
MAFS.8.SP.1.1: Construct and interpret scatter plots for bivariate measurement data to investigate patterns of association between two quantities. Describe patterns such as clustering, outliers, positive or negative association, linear association, and nonlinear association.


Printed On:4/29/2024 4:12:20 PM
Print Page | Close this window