Sample Test Item Preview


This document was generated on CPALMS - www.cpalms.org


General Information

Related Standards: MAFS.8.F.2.5
Reporting Category: Functions
Type: MC: Multiple Choice
Difficulty: N/A
Question:
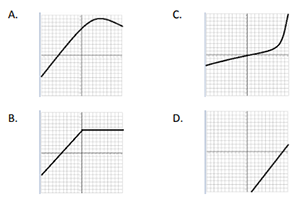
Which graph represents a linear function increasing at a constant rate?
Answer Options:

Aligned Standards

Code Description
MAFS.8.F.2.5: Describe qualitatively the functional relationship between two quantities by analyzing a graph (e.g., where the function is increasing or decreasing, linear or nonlinear). Sketch a graph that exhibits the qualitative features of a function that has been described verbally.


Printed On:4/16/2024 10:02:59 PM
Print Page | Close this window