Sample Test Item Preview


This document was generated on CPALMS - www.cpalms.org


General Information

Related Standards: MAFS.8.EE.2.5
Reporting Category: Expressions & Equations
Type: GRID: Graphic Response Item Display
Difficulty: N/A
Question:

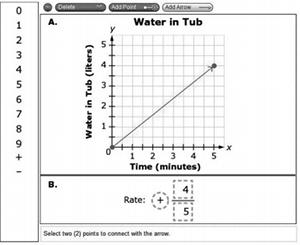
A tub that holds 18 liters of water fills with 2 liters of water every 2.5 minutes.

A. Use the Add Arrow tool to create a graph that models the situation for the first 5 minutes.

B. At what rate is the tub filling with water? Drag symbols to the circle and numbers to the boxes to show the rate.

Possible Answer:

Aligned Standards

Code Description
MAFS.8.EE.2.5: Graph proportional relationships, interpreting the unit rate as the slope of the graph. Compare two different proportional relationships represented in different ways. For example, compare a distance-time graph to a distance-time equation to determine which of two moving objects has greater speed.


Printed On:5/2/2024 3:31:57 AM
Print Page | Close this window