
Clarifications:
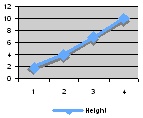
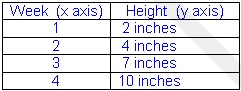
Student uses information from a plant growth chart to plot a line graph. Include original graphic : Table: Week (x axis) Height (y axis) 1 2 inches 2 4 inches 3 7 inches 5 10 inches; also a line graph depicting data in table
| Number: MA.912.A.7.In.a | Category: Independent |
| Date Adopted or Revised: 08/08 | Standard: Quadratic Equations : Draw graphs of quadratic functions. Solve quadratic equations and solve these equations by factoring, completing the square, and by using the quadratic formula. Use graphing calculators to find approximate solutions of quadratic equations. |