
Clarifications:
Essential Understandings
Concrete:
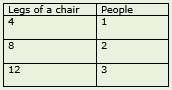
- Identify the proportional relationship using visuals.
- What is the proportional relationship below?
 8:3
8:3 - Use a table with visuals to represent proportions to solve ratio problems.
1:2
25:3
- Understand that proportions can be used to find characteristics of the population based on sample data. For example:
 (equation for the example above)
| Number: MAFS.912.S-IC.2.AP.4b | Category: Access Points |
| Date Adopted or Revised: 06/14 |
Cluster:
Make inferences and justify conclusions from sample surveys, experiments, and observational studies. (Algebra 2 - Major Cluster) : Clusters should not be sorted from Major to Supporting and then taught in that order. To do so would strip the coherence of the mathematical ideas and miss the opportunity to enhance the major work of the grade with the supporting clusters. |