Access Point #: MAFS.7.RP.1.AP.2a (Archived Access Point)


This document was generated on CPALMS - www.cpalms.org


Identify the rate of change/proportional relationship of a linear equation that has been plotted as a line on a coordinate plane.

Clarifications:

Essential Understandings

Concrete:

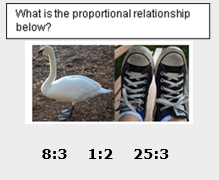
  • Identify the proportional relationship using visuals.

    What is the proportional relationship below? Image of 1 duck and pair of 2 feet with options for answers as 8:3, 1:2, and 25:3.
  • Recognize a line on a graph.
  • Identify if the line is going up or going down.
  • Given 2 points on the line, count the change going up and down between the 2 points.
  • Given 2 points on the line, count the change going left and right between the 2 points.
Representation:
  • Recognize the meaning of the placement of numbers in a proportion for a given situation.
  • Represent the proportion of objects (female students) to the total number of objects (students in class), part-to-whole.
  • Represent the proportion of the number of one object (female students) to the number of other objects (male students) from a set of objects (male and female students), part-to-part.
  • Find a percentage of a quantity as a rate per 100 (e.g., 20% of a quantity means 20/100 or .20 times the quantity).
  • Understand the following concepts, symbols, and vocabulary: proportion, ratio, rate, prices, portions per person.

Number: MAFS.7.RP.1.AP.2a Category: Access Points
Date Adopted or Revised: 06/14 Cluster: Analyze proportional relationships and use them to solve real-world and mathematical problems. (Major Cluster)

Clusters should not be sorted from Major to Supporting and then taught in that order. To do so would strip the coherence of the mathematical ideas and miss the opportunity to enhance the major work of the grade with the supporting clusters.

Related Standards

Name Description
MAFS.7.RP.1.2: Recognize and represent proportional relationships between quantities.
  1. Decide whether two quantities are in a proportional relationship, e.g., by testing for equivalent ratios in a table or graphing on a coordinate plane and observing whether the graph is a straight line through the origin.
  2. Identify the constant of proportionality (unit rate) in tables, graphs, equations, diagrams, and verbal descriptions of proportional relationships.
  3. Represent proportional relationships by equations. For example, if total cost t is proportional to the number n of items purchased at a constant price p, the relationship between the total cost and the number of items can be expressed as t = pn.
  4. Explain what a point (x, y) on the graph of a proportional relationship means in terms of the situation, with special attention to the points (0, 0) and (1, r) where r is the unit rate.


Related Courses

Name Description
1205020: M/J Accelerated Mathematics Grade 6
1205040: M/J Grade 7 Mathematics
1204000: M/J Foundational Skills in Mathematics 6-8
1205510: Explorations in Mathematics 2
7812020: Access M/J Grade 7 Mathematics
7912115: Fundamental Explorations in Mathematics 2