MAFS.3.MD.2.3Archived Standard

Draw a scaled picture graph and a scaled bar graph to represent a data set with several categories. Solve one- and two-step “how many more” and “how many less” problems using information presented in scaled bar graphs. For example, draw a bar graph in which each square in the bar graph might represent 5 pets.
General Information
Subject Area: Mathematics
Grade: 3
Domain-Subdomain: Measurement and Data
Cluster: Level 2: Basic Application of Skills & Concepts
Cluster: Represent and interpret data. (Supporting Cluster) -

Clusters should not be sorted from Major to Supporting and then taught in that order. To do so would strip the coherence of the mathematical ideas and miss the opportunity to enhance the major work of the grade with the supporting clusters.

Examples of Opportunities for In-Depth Focus

Continuous measurement quantities such as liquid volume, mass, and so on are an important context for fraction arithmetic (cf. 4.NF.2.4c, 5.NF.2.7c, 5.NF.2.3). In grade 3, students begin to get a feel for continuous measurement quantities and solve whole- number problems involving such quantities.
Date Adopted or Revised: 02/14
Date of Last Rating: 02/14
Status: State Board Approved - Archived
Assessed: Yes
Test Item Specifications

  • Assessment Limits :
    The number of data categories are six or fewer. Items must provide appropriate scale and/or key unless item is assessing that feature. Only whole number marks may be labeled on number lines.
  • Calculator :

    No

  • Context :

    Required

Sample Test Items (2)
  • Test Item #: Sample Item 1
  • Question:

    John surveys his classmates about their favorite foods, as shown in the bar graph.

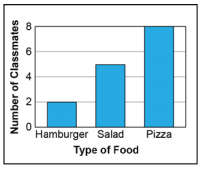
    How many more classmates prefer pizza over salad?

  • Difficulty: N/A
  • Type: EE: Equation Editor

  • Test Item #: Sample Item 2
  • Question:

    The graph shows the height of each tower that five students built for a social studies project.

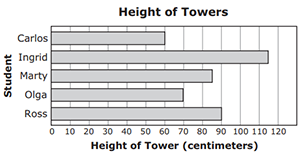
    How many centimeters taller is the tower that Ross built than the tower that Carlos built?


  • Difficulty: N/A
  • Type: MC: Multiple Choice

Related Courses

This benchmark is part of these courses.
5012050: Grade Three Mathematics (Specifically in versions: 2014 - 2015, 2015 - 2022, 2022 and beyond (current))
5008050: Health - Grade 3 (Specifically in versions: 2014 - 2015, 2015 - 2022, 2022 and beyond (current))
5021050: Social Studies Grade 3 (Specifically in versions: 2014 - 2015, 2015 - 2022, 2022 - 2023, 2023 and beyond (current))
7712040: Access Mathematics Grade 3 (Specifically in versions: 2014 - 2015, 2015 - 2018, 2018 - 2022, 2022 and beyond (current))
5020100: STEM Lab Grade 3 (Specifically in versions: 2016 - 2022, 2022 and beyond (current))
5012055: Grade 3 Accelerated Mathematics (Specifically in versions: 2019 - 2022, 2022 and beyond (current))
7708030: Access Health Grade 3 (Specifically in versions: 2020 - 2023, 2023 and beyond (current))
5012015: Foundational Skills in Mathematics 3-5 (Specifically in versions: 2019 - 2022, 2022 and beyond (current))

Related Access Points

Alternate version of this benchmark for students with significant cognitive disabilities.

Related Resources

Vetted resources educators can use to teach the concepts and skills in this benchmark.

Assessment

Grade 3 Physical Science Unit: Properties Assessment :

Use this summative assessment to assess the students' understanding of the topics presented in within this Grade 3 Physical Science Unit: Properties.  The assessment can either be cumulative or broken into topics presented within the unit.

This assessment is part of the CPALMS Grade 3 Physical Science Unit on Properties. This is a themed unit of SaM-1's adventures at the CPALMS Rehabilitation and Conservation Center.  To see all the lessons in the unit please visit https://www.cpalms.org/page818.aspx .

Type: Assessment

Educational Software / Tool

Free Graph Paper:

A variety of graph paper types for printing, including Cartesian, polar, engineering, isometric, logarithmic, hexagonal, probability, and Smith chart.

Type: Educational Software / Tool

Formative Assessments

Collecting Cans for Recycling:

Students answer questions about a scaled bar graph.

Type: Formative Assessment

Lunch Orders:

Students are asked to create a scaled bar graph from a given set of data.

Type: Formative Assessment

Flowers in the Garden:

Students are asked to create a pictograph from a given set of data.

Type: Formative Assessment

Favorite After School Activity:

Students are asked to sort a set of data and create a scaled bar graph using their sorted data.

Type: Formative Assessment

Lesson Plans

Going to the Dogs?:

In this integrated lesson plan, students will use their knowledge of collecting and interpreting data as they participate in a hypothetical election based on the controversy of whether or not their community should have a leash law. Students will be given background knowledge of the differences between state and local governments, and how laws are enacted, in particular, “leash laws” for dogs. The students will vote, tally the results, and use a frequency table to create a bar graph determining the range, title, and labels. Students will then interpret the election results while answering one- and two-step problems based on their bar graphs while demonstrating their knowledge of different levels of government and the importance of voting in local elections.


Type: Lesson Plan

Raising the Bar:

Students will create and interpret bar graphs using tally mark data from a table. Students will also discuss and understand the implications of our civic duty to vote, and how this affects data for polls and decision-making, in this integrated lesson plan.

Type: Lesson Plan

Physical Science Unit: Water Beach Vacation Lesson 2 Changes to Water: Boiling and Freezing:

Students learn water can change state of matter through the addition or removal of heat.
Students will learn the boiling and freezing points of water at standard pressure. Students
will also review how data can be used to create line graphs and these graphs can show
patterns and changes to temperature over time.

This is a lesson in the Grade 3 Physical Science Unit on Water. This is a themed unit of SaM-1's adventures while on a Beach Vacation.  To see all the lessons in the unit please visit  https://www.cpalms.org/page818.aspx.

Type: Lesson Plan

Physical Science Unit: Properties Lesson 19 Sand Temperature Lab Investigation: Graphing Data for Evidence:

Students will create line graphs from the collected data on the temperature of shaded and non-shaded sand from the previous lesson. Students will use the data and graphs as evidence to make conclusions on if the shading had an impact on sand temperature. This lesson could also be taught using Math instructional time.

This is a lesson in the Grade 3 Physical Science Unit on Properties. This is a themed unit of SaM-1's adventures at the CPALMS Rehabilitation and Conservation Center.  To see all the lessons in the unit please visit https://www.cpalms.org/page818.aspx .

Type: Lesson Plan

Physical Science Unit: Properties Lesson 18 Sand Temperature Lab Investigation: Data Collection:

Students will set up the lab investigation that they planned in the previous lesson and collect data on the temperature of shaded and non-shaded sand. This lesson could also be taught using Math instructional time. 

This is a lesson in the Grade 3 Physical Science Unit on Properties. This is a themed unit of SaM-1's adventures at the CPALMS Rehabilitation and Conservation Center.  To see all the lessons in the unit please visit https://www.cpalms.org/page818.aspx .

Type: Lesson Plan

Physical Science Unit: Properties Lesson 16 Reading And Recording Temperature:

Students will make observations based on the property of temperature while representing the data in line graphs. This lesson could also be taught using mathematics instructional time. 

This is a lesson in the Grade 3 Physical Science Unit on Properties. This is a themed unit of SaM-1's adventures at the CPALMS Rehabilitation and Conservation Center.  To see all the lessons in the unit please visit https://www.cpalms.org/page818.aspx .

Type: Lesson Plan

Physical Science Unit: Properties Lesson 4 Length & Line Plots: Centimeters:

Students will make observations based on the property of size, specifically length, measuring in metric while organizing the data in line plots.  This lesson could be co-taught using mathematics instructional time. 

This is a lesson in the Grade 3 Physical Science Unit on Properties. This is a themed unit of SaM-1's adventures at the CPALMS Rehabilitation and Conservation Center.  To see all the lessons in the unit please visit  https://www.cpalms.org/page818.aspx.


Type: Lesson Plan

Physical Science Unit: Properties Lesson 6 Grouping by Length:

Students will make observations based on the property of size, specifically length, measuring in both metric and customary systems while organizing the data in line plots.  This lesson could be co-taught using mathematics instructional time. 

This is a lesson in the Grade 3 Physical Science Unit on Properties. This is a themed unit of SaM-1's adventures at the CPALMS Rehabilitation and Conservation Center.  To see all the lessons in the unit please visit  https://www.cpalms.org/page818.aspx.


Type: Lesson Plan

If You Build It, It Will Grow!:

In this project students are challenged to build a greenhouse and plant seeds using the Engineering Design Process. They will measure plant growth over time and assess the quality of their greenhouses according to the results. Through this process students will gain an understanding of how plants respond to stimuli (heat, light, gravity) and will understand that plants need energy from the sun to make their own food. By designing and testing their greenhouses students will understand that using different materials can result in different outcomes. Students will observe different plant growth patterns and record their results. By doing this, students will see the importance of accurate note taking and be able to participate in group discussions by providing their evidence organized in graphs and tables.

Type: Lesson Plan

Response to the Cues:

This is a design challenge that requires students to cooperatively create a plant terrarium through the process of asking questions, imagining what the design would look like, planning the design, creating the design, testing the design, improving the design, and finally testing their redesign.

Type: Lesson Plan

Rampin' It Up:

Students will use their knowledge of properties of materials and measurement of length to determine how the properties of different surfaces affect the distance traveled by a toy car.

Type: Lesson Plan

Graphs Your Way!:

In this lesson students go on a field trip around the school.  They will collect data from adults about their favorite movie and from children about their favorite video game.  They will use this information to construct their own scaled horizontal/vertical bar graphs or scaled pictographs. They will write situational stories/questions to accompany their graphs.  They will also collaborate with their peers to compare and contrast a pictograph with a bar graph.

Type: Lesson Plan

Paper Airplanes Away!:

In this lesson, students will design and fly their own paper airplane and analyze their flight data to determine the best designs for getting planes to travel the farthest distance. Students will organize class flight data into a line plot and calculate the mean, median, mode, and range for the data set.

Type: Lesson Plan

Having a Field Day:

In this MEA, students will rank t-shirt companies from the best price to the worst price by considering data such as purchase price, shipping fees, sizes, colors, etc. as well as notes regarding the amount of students enrolled. In the twist, students will be given information on additional requirements from the principal for specific shirt colors for each grade as well as the additional add-on of the school's logo (an elephant).

Model Eliciting Activities, MEAs, are open-ended, interdisciplinary problem-solving activities that are meant to reveal students’ thinking about the concepts embedded in realistic situations. MEAs resemble engineering problems and encourage students to create solutions in the form of mathematical and scientific models. Students work in teams to apply their knowledge of science and mathematics to solve an open-ended problem, while considering constraints and tradeoffs. Students integrate their ELA skills into MEAs as they are asked to clearly document their thought process. MEAs follow a problem-based, student centered approach to learning, where students are encouraged to grapple with the problem while the teacher acts as a facilitator. To learn more about MEA’s visit: https://www.cpalms.org/cpalms/mea.aspx

Type: Lesson Plan

Bulletin Board Brainiacs Graphing MEA:

This is a 3rd grade MEA in which students are faced with determining the quantity of each letter to put into a bulletin board letter packet, based on the frequency of the letters in the Data Set. Students graph the data in a bar graph and in a picture graph. After they have solved the first problem, they are presented with new data and are forced to reconsider their decision. Students will take brief notes during the graphing videos and will conduct research.

Model Eliciting Activities, MEAs, are open-ended, interdisciplinary problem-solving activities that are meant to reveal students’ thinking about the concepts embedded in realistic situations. Click here to learn more about MEAs and how they can transform your classroom.

Type: Lesson Plan

Candy Judging:

In this activity, students conduct an investigation to determine which of four chocolate candies is most preferred by the class. Each student will taste one each of four candies and will rate them from most to least favorite. Students will then construct a line plot and a bar graph to determine which types of chocolate were selected as the most and least favorite. Students will also generate a method to decide which candy was the overall class favorite. Conclusions are drawn based on the analysis in the context of the question(s) asked.

Type: Lesson Plan

Raincoats Are Us:

Students are asked to interpret and graph data in order to design a method for choosing the best raincoat company to supply a distributor in Florida.

Model Eliciting Activities, MEAs, are open-ended, interdisciplinary problem-solving activities that are meant to reveal students’ thinking about the concepts embedded in realistic situations. Click here to learn more about MEAs and how they can transform your classroom.

Type: Lesson Plan

This Is My Country:

Students will collect and represent categorical data (countries or states/districts of birth of third graders) on a scaled bar graph using an appropriate title, labels, and units. They will interpret and discuss the data by writing and solving one-step problems. It is suggested the students later use this same data to create a scaled pictograph and then compare the two representations.

Type: Lesson Plan

Healthy Habits:

Students will determine what two snacks should be placed in the school vending machines because the district is asking for healthier and tastier snacks. Factors to consider are calories, fat, protein, sugar, student comments, and cost.

Model Eliciting Activities, MEAs, are open-ended, interdisciplinary problem-solving activities that are meant to reveal students’ thinking about the concepts embedded in realistic situations. Click here to learn more about MEAs and how they can transform your classroom.

Type: Lesson Plan

Dining Dilemma!:

The students will compare different nutritional content of chicken nuggets from many restaurants. They will factor in the calories, the total fat, saturated fat, and sodium levels in the nuggets to rank the nuggets from healthiest to least healthy.

Model Eliciting Activities, MEAs, are open-ended, interdisciplinary problem-solving activities that are meant to reveal students’ thinking about the concepts embedded in realistic situations. Click here to learn more about MEAs and how they can transform your classroom.

Type: Lesson Plan

Picking Pets:

Using information about the needs of different animals, students will help choose which pet would be best to purchase for a classroom.

Model Eliciting Activities, MEAs, are open-ended, interdisciplinary problem-solving activities that are meant to reveal students’ thinking about the concepts embedded in realistic situations. MEAs resemble engineering problems and encourage students to create solutions in the form of mathematical and scientific models. Students work in teams to apply their knowledge of science and mathematics to solve an open-ended problem, while considering constraints and tradeoffs. Students integrate their ELA skills into MEAs as they are asked to clearly document their thought process. MEAs follow a problem-based, student centered approach to learning, where students are encouraged to grapple with the problem while the teacher acts as a facilitator. To learn more about MEA’s visit: https://www.cpalms.org/cpalms/mea.aspx

Type: Lesson Plan

Thrift Town Melt-Down - Let's Cool up!:

During this activity, students will look at data from a fictional town, Thrift Town and develop a strategy of choosing which material would be the best to help insulate an ice cream container. The students will utilize higher order thinking skills, as well as deduction to find a solution.

Model Eliciting Activities, MEAs, are open-ended, interdisciplinary problem-solving activities that are meant to reveal students’ thinking about the concepts embedded in realistic situations. MEAs resemble engineering problems and encourage students to create solutions in the form of mathematical and scientific models. Students work in teams to apply their knowledge of science and mathematics to solve an open-ended problem, while considering constraints and tradeoffs. Students integrate their ELA skills into MEAs as they are asked to clearly document their thought process. MEAs follow a problem-based, student centered approach to learning, where students are encouraged to grapple with the problem while the teacher acts as a facilitator. To learn more about MEA’s visit: https://www.cpalms.org/cpalms/mea.aspx

Type: Lesson Plan

Spacesuits Unlimited MEA:

In this open-ended problem, students will work in teams to determine a procedure for selecting a company from which to purchase spacesuits. Students will make decisions based on a table that includes company, cost per suit, color, durability, materials, and comfort. Students will determine the price per flight, graph the provided information, and write a letter to the client providing evidence for their decisions.

Model Eliciting Activities, MEAs, are open-ended, interdisciplinary problem-solving activities that are meant to reveal students’ thinking about the concepts embedded in realistic situations. Click here to learn more about MEAs and how they can transform your classroom.

Type: Lesson Plan

Introduction to Bar Graphs:

This lesson allows students to learn what bar graphs are used for, how to interpret the data presented, and how to organize their own data using bar graphs.

Type: Lesson Plan

Fitness Frenzy:

In this lesson, students will interpret data represented with tally marks, tables, pictographs, and bar graphs and represent data using pictographs and bar graphs with appropriate titles, labels and units.

Type: Lesson Plan

Lunchroom Logistics:

The principal needs help planning the school lunch schedule!  Students will plan a lunch schedule to accommodate all of the students in the school.  However, there can only be 100 students in the cafeteria at a time and only 20 students can sit at a table.  Students will figure out how to arrange the lunch schedule so that every class eats together and so that certain grade levels are not together at the same time.

Model Eliciting Activities, MEAs, are open-ended, interdisciplinary problem-solving activities that are meant to reveal students’ thinking about the concepts embedded in realistic situations. Click here to learn more about MEAs and how they can transform your classroom.

Type: Lesson Plan

Model Eliciting Activity (MEA) STEM Lessons

Physical Science Unit: Water Beach Vacation Lesson 16 Beat the Heat MEA Part 3: Analyzing Cooler Data:

In this MEA, students will have the opportunity to apply what they learned about describing
the changes water undergoes when it changes state through heating and cooling. This MEA
is divided into four parts. In part 1, students will develop their hypothesis and receive
information on how to set up the cooler experiment. In part 2, students will be asked to use
ice to test the coolers they designed in Beat the Heat Engineering Design Lessons.
Students will take measurements and collect data on their cooler. In Part 3 of this activity,
students will analyze the data they collected in Part 2 by drawing and interpreting a scaled
bar graph and line graph. Students will participate in a discussion about how to interpret the
data that was collected. Finally, in part 4 they will develop a procedure for selecting the best
cooler to keep water frozen the longest at the beach. In the optional twist, students will
need to take the mass of the cooler into account.

This is a lesson in the Grade 3 Physical Science Unit on Water. This is a themed unit of SaM-1's adventures while on a Beach Vacation.  To see all the lessons in the unit please visit https://www.cpalms.org/page818.aspx.

Type: Model Eliciting Activity (MEA) STEM Lesson

Physical Science Unit: Water Beach Vacation Lesson 17 Beat the Heat MEA Part 4: Ranking Procedure:

In this MEA, students will have the opportunity to apply what they learned about describing
the changes water undergoes when it changes state through heating and cooling. This MEA
is divided into four parts. In part 1, students will develop their hypothesis and receive
information on how to set up the cooler experiment. In part 2, students will be asked to use
ice to test the coolers they designed in Beat the Heat Engineering Design Lessons.
Students will take measurements and collect data on their cooler. In part 3, students will
analyze the data they collected. Finally, in part 4 they will develop a procedure for selecting
the best cooler to keep water frozen the longest at the beach. They will communicate their
findings and procedure via a letter to next year’s class. In the optional twist, students will
need to take the mass of the cooler into account.

This is a lesson in the Grade 3 Physical Science Unit on Water. This is a themed unit of SaM-1's adventures while on a Beach Vacation.  To see all the lessons in the unit please visit https://www.cpalms.org/page818.aspx.

Type: Model Eliciting Activity (MEA) STEM Lesson

Original Student Tutorials

Lesson 23 Video: MEA Researching Sea Turtle Nesting Temperatures :

In this video Sam-1 introduces a Model Eliciting Activity (MEA) challenge. Students will take their prior experiences from the properties unit and apply their knowledge of investigating sea turtle nesting temperatures.  

Students will develop a hypothesis, design an experiment, and support their reasoning to determine how to best study different methods for cooling sea turtle nesting areas.

Type: Original Student Tutorial

Lesson 16 Video: Reading & Recording Temperature :

In this SaM-1 video, students will learn how to make observations based on the property of temperature using thermometers, while representing the data in line graphs.

Type: Original Student Tutorial

Bar Graph Jones and the Pyramid of Pi:

Learn to use the information presented in scaled bar graphs to solve one-step “how many more” and “how many fewer” problems.

Type: Original Student Tutorial

Problem-Solving Task

Classroom Supplies:

The purpose of this task is for students to solve problems involving the four operations and draw a scaled bar graph to represent a data set with several categories.

Type: Problem-Solving Task

Teaching Ideas

How Deep Do They Dive-SeaWorld Classroom Activity:

In this activity, students relate pictures to mathematical ideas and create a graph. They are given approximate maximum diving depths for five whales and they must determine how to represent this data on a pictograph.

Type: Teaching Idea

Weather or Not? (NCTM) - Featured for Math and Science Day:

These activities give students opportunities to investigate weather conditions that involve reading and recording temperatures, graphing, making charts, solving word problems, and working with numbers.

Used with permission from Teaching Children Mathematics, copyright April 2008 by the National Council of Teachers of Mathematics. All rights reserved.

Type: Teaching Idea

Virtual Manipulatives

Data Grapher:

Students use this interactive tool to explore the connections between data sets and their representations in charts and graphs. Enter data in a table (1 to 6 columns, unlimited rows), and preview or print bar graphs, line graphs, pie charts, and pictographs. Students can select which set(s) of data to display in each graph, and compare the effects of different representations of the same data. Instructions and exploration questions are provided using the expandable "+" signs above the tool.

Type: Virtual Manipulative

Bar Graph:

This lesson is designed to give students experience creating and reading bar graphs. The lesson provides links to a practice data set and the bar graph activity so that students can practice making bar graphs and check their work using the activity. Finally, the lesson provides a suggested follow-up to this lesson.

Type: Virtual Manipulative

KidsZone: Create a Graph:

Create bar, line, pie, area, and xy graphs.

Type: Virtual Manipulative

Histogram:

In this activity, students can create and view a histogram using existing data sets or original data entered. Students can adjust the interval size using a slider bar, and they can also adjust the other scales on the graph. This activity allows students to explore histograms as a way to represent data as well as the concepts of mean, standard deviation, and scale. This activity includes supplemental materials, including background information about the topics covered, a description of how to use the application, and exploration questions for use with the java applet.

Type: Virtual Manipulative

STEM Lessons - Model Eliciting Activity

Bulletin Board Brainiacs Graphing MEA:

This is a 3rd grade MEA in which students are faced with determining the quantity of each letter to put into a bulletin board letter packet, based on the frequency of the letters in the Data Set. Students graph the data in a bar graph and in a picture graph. After they have solved the first problem, they are presented with new data and are forced to reconsider their decision. Students will take brief notes during the graphing videos and will conduct research.

Model Eliciting Activities, MEAs, are open-ended, interdisciplinary problem-solving activities that are meant to reveal students’ thinking about the concepts embedded in realistic situations. Click here to learn more about MEAs and how they can transform your classroom.

Dining Dilemma!:

The students will compare different nutritional content of chicken nuggets from many restaurants. They will factor in the calories, the total fat, saturated fat, and sodium levels in the nuggets to rank the nuggets from healthiest to least healthy.

Model Eliciting Activities, MEAs, are open-ended, interdisciplinary problem-solving activities that are meant to reveal students’ thinking about the concepts embedded in realistic situations. Click here to learn more about MEAs and how they can transform your classroom.

Having a Field Day:

In this MEA, students will rank t-shirt companies from the best price to the worst price by considering data such as purchase price, shipping fees, sizes, colors, etc. as well as notes regarding the amount of students enrolled. In the twist, students will be given information on additional requirements from the principal for specific shirt colors for each grade as well as the additional add-on of the school's logo (an elephant).

Model Eliciting Activities, MEAs, are open-ended, interdisciplinary problem-solving activities that are meant to reveal students’ thinking about the concepts embedded in realistic situations. MEAs resemble engineering problems and encourage students to create solutions in the form of mathematical and scientific models. Students work in teams to apply their knowledge of science and mathematics to solve an open-ended problem, while considering constraints and tradeoffs. Students integrate their ELA skills into MEAs as they are asked to clearly document their thought process. MEAs follow a problem-based, student centered approach to learning, where students are encouraged to grapple with the problem while the teacher acts as a facilitator. To learn more about MEA’s visit: https://www.cpalms.org/cpalms/mea.aspx

Healthy Habits:

Students will determine what two snacks should be placed in the school vending machines because the district is asking for healthier and tastier snacks. Factors to consider are calories, fat, protein, sugar, student comments, and cost.

Model Eliciting Activities, MEAs, are open-ended, interdisciplinary problem-solving activities that are meant to reveal students’ thinking about the concepts embedded in realistic situations. Click here to learn more about MEAs and how they can transform your classroom.

Lunchroom Logistics:

The principal needs help planning the school lunch schedule!  Students will plan a lunch schedule to accommodate all of the students in the school.  However, there can only be 100 students in the cafeteria at a time and only 20 students can sit at a table.  Students will figure out how to arrange the lunch schedule so that every class eats together and so that certain grade levels are not together at the same time.

Model Eliciting Activities, MEAs, are open-ended, interdisciplinary problem-solving activities that are meant to reveal students’ thinking about the concepts embedded in realistic situations. Click here to learn more about MEAs and how they can transform your classroom.

Picking Pets:

Using information about the needs of different animals, students will help choose which pet would be best to purchase for a classroom.

Model Eliciting Activities, MEAs, are open-ended, interdisciplinary problem-solving activities that are meant to reveal students’ thinking about the concepts embedded in realistic situations. MEAs resemble engineering problems and encourage students to create solutions in the form of mathematical and scientific models. Students work in teams to apply their knowledge of science and mathematics to solve an open-ended problem, while considering constraints and tradeoffs. Students integrate their ELA skills into MEAs as they are asked to clearly document their thought process. MEAs follow a problem-based, student centered approach to learning, where students are encouraged to grapple with the problem while the teacher acts as a facilitator. To learn more about MEA’s visit: https://www.cpalms.org/cpalms/mea.aspx

Raincoats Are Us:

Students are asked to interpret and graph data in order to design a method for choosing the best raincoat company to supply a distributor in Florida.

Model Eliciting Activities, MEAs, are open-ended, interdisciplinary problem-solving activities that are meant to reveal students’ thinking about the concepts embedded in realistic situations. Click here to learn more about MEAs and how they can transform your classroom.

Spacesuits Unlimited MEA:

In this open-ended problem, students will work in teams to determine a procedure for selecting a company from which to purchase spacesuits. Students will make decisions based on a table that includes company, cost per suit, color, durability, materials, and comfort. Students will determine the price per flight, graph the provided information, and write a letter to the client providing evidence for their decisions.

Model Eliciting Activities, MEAs, are open-ended, interdisciplinary problem-solving activities that are meant to reveal students’ thinking about the concepts embedded in realistic situations. Click here to learn more about MEAs and how they can transform your classroom.

Thrift Town Melt-Down - Let's Cool up!:

During this activity, students will look at data from a fictional town, Thrift Town and develop a strategy of choosing which material would be the best to help insulate an ice cream container. The students will utilize higher order thinking skills, as well as deduction to find a solution.

Model Eliciting Activities, MEAs, are open-ended, interdisciplinary problem-solving activities that are meant to reveal students’ thinking about the concepts embedded in realistic situations. MEAs resemble engineering problems and encourage students to create solutions in the form of mathematical and scientific models. Students work in teams to apply their knowledge of science and mathematics to solve an open-ended problem, while considering constraints and tradeoffs. Students integrate their ELA skills into MEAs as they are asked to clearly document their thought process. MEAs follow a problem-based, student centered approach to learning, where students are encouraged to grapple with the problem while the teacher acts as a facilitator. To learn more about MEA’s visit: https://www.cpalms.org/cpalms/mea.aspx

MFAS Formative Assessments

Collecting Cans for Recycling:

Students answer questions about a scaled bar graph.

Favorite After School Activity:

Students are asked to sort a set of data and create a scaled bar graph using their sorted data.

Flowers in the Garden:

Students are asked to create a pictograph from a given set of data.

Lunch Orders:

Students are asked to create a scaled bar graph from a given set of data.

Original Student Tutorials Mathematics - Grades K-5

Bar Graph Jones and the Pyramid of Pi:

Learn to use the information presented in scaled bar graphs to solve one-step “how many more” and “how many fewer” problems.

Student Resources

Vetted resources students can use to learn the concepts and skills in this benchmark.

Original Student Tutorials

Lesson 23 Video: MEA Researching Sea Turtle Nesting Temperatures :

In this video Sam-1 introduces a Model Eliciting Activity (MEA) challenge. Students will take their prior experiences from the properties unit and apply their knowledge of investigating sea turtle nesting temperatures.  

Students will develop a hypothesis, design an experiment, and support their reasoning to determine how to best study different methods for cooling sea turtle nesting areas.

Type: Original Student Tutorial

Lesson 16 Video: Reading & Recording Temperature :

In this SaM-1 video, students will learn how to make observations based on the property of temperature using thermometers, while representing the data in line graphs.

Type: Original Student Tutorial

Bar Graph Jones and the Pyramid of Pi:

Learn to use the information presented in scaled bar graphs to solve one-step “how many more” and “how many fewer” problems.

Type: Original Student Tutorial

Problem-Solving Task

Classroom Supplies:

The purpose of this task is for students to solve problems involving the four operations and draw a scaled bar graph to represent a data set with several categories.

Type: Problem-Solving Task

Virtual Manipulatives

Data Grapher:

Students use this interactive tool to explore the connections between data sets and their representations in charts and graphs. Enter data in a table (1 to 6 columns, unlimited rows), and preview or print bar graphs, line graphs, pie charts, and pictographs. Students can select which set(s) of data to display in each graph, and compare the effects of different representations of the same data. Instructions and exploration questions are provided using the expandable "+" signs above the tool.

Type: Virtual Manipulative

Histogram:

In this activity, students can create and view a histogram using existing data sets or original data entered. Students can adjust the interval size using a slider bar, and they can also adjust the other scales on the graph. This activity allows students to explore histograms as a way to represent data as well as the concepts of mean, standard deviation, and scale. This activity includes supplemental materials, including background information about the topics covered, a description of how to use the application, and exploration questions for use with the java applet.

Type: Virtual Manipulative

Parent Resources

Vetted resources caregivers can use to help students learn the concepts and skills in this benchmark.

Problem-Solving Task

Classroom Supplies:

The purpose of this task is for students to solve problems involving the four operations and draw a scaled bar graph to represent a data set with several categories.

Type: Problem-Solving Task