MAFS.8.EE.2.5Archived Standard

Graph proportional relationships, interpreting the unit rate as the slope of the graph. Compare two different proportional relationships represented in different ways. For example, compare a distance-time graph to a distance-time equation to determine which of two moving objects has greater speed.

Remarks

Examples of Opportunities for In-Depth Focus

When students work toward meeting this standard, they build on grades 6–7 work with proportions and position themselves for grade 8 work with functions and the equation of a line.
General Information
Subject Area: Mathematics
Grade: 8
Domain-Subdomain: Expressions & Equations
Cluster: Level 2: Basic Application of Skills & Concepts
Cluster: Understand the connections between proportional relationships, lines, and linear equations. (Major Cluster) -

Clusters should not be sorted from Major to Supporting and then taught in that order. To do so would strip the coherence of the mathematical ideas and miss the opportunity to enhance the major work of the grade with the supporting clusters.

Date Adopted or Revised: 02/14
Date of Last Rating: 02/14
Status: State Board Approved - Archived
Assessed: Yes
Test Item Specifications

  • Assessment Limits :

    Numbers in items must be rational numbers

  • Calculator :

    Yes

  • Context :

    Allowable

Sample Test Items (3)
  • Test Item #: Sample Item 1
  • Question:

    The graph of a proportional relationship is shown.

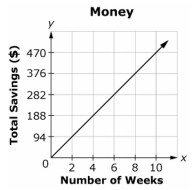
    What is the amount of savings per week?

  • Difficulty: N/A
  • Type: EE: Equation Editor

  • Test Item #: Sample Item 2
  • Question:

    The graph of a proportional relationship and an equation are shown.

       y space equals space 11 over 2 x space plus 3

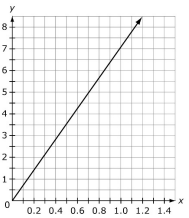
    What is the greater unit rate?

  • Difficulty: N/A
  • Type: EE: Equation Editor

  • Test Item #: Sample Item 3
  • Question:

    A tub that holds 18 liters of water fills with 2 liters of water every 2.5 minutes.

    A. Use the Add Arrow tool to create a graph that models the situation for the first 5 minutes.

    B. At what rate is the tub filling with water? Drag symbols to the circle and numbers to the boxes to show the rate.

  • Difficulty: N/A
  • Type: GRID: Graphic Response Item Display

Related Courses

This benchmark is part of these courses.
1205050: M/J Accelerated Mathematics Grade 7 (Specifically in versions: 2014 - 2015, 2015 - 2020, 2020 - 2022, 2022 and beyond (current))
1205070: M/J Grade 8 Pre-Algebra (Specifically in versions: 2014 - 2015, 2015 - 2022, 2022 and beyond (current))
1204000: M/J Foundational Skills in Mathematics 6-8 (Specifically in versions: 2014 - 2015, 2015 - 2022, 2022 and beyond (current))
1200410: Mathematics for College Success (Specifically in versions: 2014 - 2015, 2015 - 2022 (course terminated))
1200700: Mathematics for College Algebra (Specifically in versions: 2014 - 2015, 2015 - 2022 (course terminated))
7812030: Access M/J Grade 8 Pre-Algebra (Specifically in versions: 2014 - 2015, 2015 - 2018, 2018 - 2019, 2019 - 2022, 2022 and beyond (current))
7820017: Access M/J Comprehensive Science 3 (Specifically in versions: 2014 - 2015, 2015 - 2018, 2018 - 2023, 2023 and beyond (current))
7912115: Fundamental Explorations in Mathematics 2 (Specifically in versions: 2013 - 2015, 2015 - 2017 (course terminated))

Related Access Points

Alternate version of this benchmark for students with significant cognitive disabilities.

Related Resources

Vetted resources educators can use to teach the concepts and skills in this benchmark.

Educational Software / Tool

Free Graph Paper:

A variety of graph paper types for printing, including Cartesian, polar, engineering, isometric, logarithmic, hexagonal, probability, and Smith chart.

Type: Educational Software / Tool

Formative Assessments

Lines and Linear Equations:

This lesson is intended to help you assess how well students are able to:

  • Interpret speed as the slope of a linear graph.
  • Translate between the equation of a line and its graphical representation.

Type: Formative Assessment

Compare Slopes:

Students are asked to identify, describe and compare the slopes of two proportional relationships given the graph of one and the equation of the other.

Type: Formative Assessment

Proportional Paint:

Students are given a graph of a proportional relationship and asked to determine the unit rate of the relationship and compare it to the slope of the graph.

Type: Formative Assessment

Interpreting Slope:

Students are asked to graph a proportional relationship, given a table of values, and find and interpret the slope.

Type: Formative Assessment

Lesson Plans

Slope Intercept - Lesson #2:

This is lesson 2 of 3 in the Slope Intercept unit. This lesson introduces graphing non-proportional linear relationships. In this lesson students will perform an activity to collect data to derive y = mx + b and will use a Scratch program to plot the graph of the data, as well as check for proportional and/or linear relationships.

Type: Lesson Plan

Slope Intercept - Lesson #1:

This is lesson 1 of 3 in the Slope Intercept unit. This lesson introduces graphing proportional relationships. In this lesson students will perform an experiment to find and relate density of two different materials to the constant of proportionality and unit rate.

Type: Lesson Plan

Seeing the Slope:

This 5E lesson will build on students' prior knowledge of positive proportional relationships and graphing them. It will introduce students to negative values of slopes, which will lead to graphing negative proportional relationships. Students will discover properties of different values of slope and have the opportunity to practice graphing. This lesson is designed to be done in a 50-minute block.

Type: Lesson Plan

Lines and Linear Equations:

This lesson unit is intended to help you assess how well students are able to interpret speed as the slope of a linear graph and translate between the equation of a line and its graphical representation.

Type: Lesson Plan

Running and Rising:

In this lesson students will graph and compare two proportional relationships from different representations in contextual problems and be introduced to the constant of proportionality as the unit rate.

Type: Lesson Plan

Discovering Kepler's Law for the Periods of Planets:

Students listen to a video that describes Kepler's determination that planetary orbits are elliptical and then will use data for the solar distance and periods of several of the planets in the solar system, then investigate several hypotheses to determine which is supported by the data.

Type: Lesson Plan

Constructing and Calibrating a Hydrometer:

Students construct and calibrate a simple hydrometer using different salt solutions. They then graph their data and determine the density and salinity of an unknown solution using their hydrometer and graphical analysis.

Type: Lesson Plan

How Fast Can You Walk? (Graphing and Interpreting Slope):

This lesson requires that the students walk in the hallway along a path marked every five feet and record the total distance they traveled over 8 seconds. The students then use this point and the origin to graph a line of distance versus time. A class discussion then leads the students to understand that the slope of the line is their walking speed and this can be found using rise over run.

Type: Lesson Plan

What's the Going Rate?:

Students discover that the unit rate and the slope of a line are the same, and these can be used to compare two different proportional relationships. Students compare proportional relationships presented in table and graph form.

Type: Lesson Plan

Who goes faster, earns more, drives farthest?:

Given a proportional relationship, students will determine the constant of proportionality, write an equation, graph the relationship, and interpret in context.

Type: Lesson Plan

Problem-Solving Tasks

DVD Profits, Variation 1:

In this task, students are asked to determine the unit price of a product under two different circumstances. They are also asked to generalize the cost of producing x items in each case.

Type: Problem-Solving Task

Sore Throats, Variation 2:

Students graph proportional relationships and understand the unit rate as a measure of the steepness of the related line, called the slope. Students will also treat slopes more formally when they graph proportional relationships and interpret the unit rate as the slope of the graph.

Type: Problem-Solving Task

Who Has the Best Job?:

This task asks the student to graph and compare two proportional relationships and interpret the unit rate as the slope of the graph. Students are also asked to write an equation and graph each scenario.

Type: Problem-Solving Task

Coffee by the Pound:

Students will answer questions about unit price of coffee, make a graph of the information, and explain the meaning of constant of proportionality/slope in the given context.

Type: Problem-Solving Task

Comparing Speeds in Graphs and Equations:

This task provides the opportunity for students to reason about graphs, slopes, and rates without having a scale on the axes or an equation to represent the graphs. Students who prefer to work with specific numbers can write in scales on the axes to help them get started.

Type: Problem-Solving Task

Peaches and Plums:

This task asks students to reason about the relative costs per pound of two fruits without actually knowing what the costs are. Students who find this difficult may add a scale to the graph and reason about the meanings of the ordered pairs. Comparing the two approaches in a class discussion can be a profitable way to help students make sense of slope.

Type: Problem-Solving Task

Equations of Lines:

This task asks the student to understand the relationship between slope and changes in x- and y-values of a linear function.

Type: Problem-Solving Task

Find the Change:

This activity challenges students to recognize the relationship between slope and the difference in x- and y-values of a linear function. Help students solidify their understanding of linear functions and push them to be more fluent in their reasoning about slope and y-intercepts. This task has also produced a reasonable starting place for discussing point-slope form of a linear equation.

Type: Problem-Solving Task

Student Center Activity

Edcite: Mathematics Grade 8:

Students can practice answering mathematics questions on a variety of topics. With an account, students can save their work and send it to their teacher when complete.

Type: Student Center Activity

Teaching Ideas

Now That is a Dense Graph:

Students will first measure and plot the total mass vs liquid volume in a graduated cylinder. They will then use slope and the mathematical formula for the plot to determine the density of the liquid, the density of a solid added to the liquid, and the mass of the graduated cylinder.

Type: Teaching Idea

Now That is a Dense Graph:

In this activity, the density of ethanol is found by graphical means. In the second part, the density of sodium thiosulfate is found, also by graphical means. The values found are then analyzed statistically.

Type: Teaching Idea

Tutorial

Linear Equations:

This tutorial will help you to explore slopes of lines and see how slope is represented on the x-y axes.

Type: Tutorial

Unit/Lesson Sequences

Linear Functions and Slope:

This session on linear function and slope contains five parts, multiple problems and videos, and interactive activities geared to help students recognize and understand linear relationships, explore slope and dependent and independent variables in graphs of linear relationships, and develop an understanding of rates and how they are related to slopes and equations. Throughout the session, students use spreadsheets to complete the work, and are encouraged to think about the ways technology can aid in teaching and understanding. The solutions for all problems are given, and many allow students to have a hint or tip as they solve. There is even a homework assignment with four problems for students after they have finished all five parts of the session.

Type: Unit/Lesson Sequence

Proportional Reasoning:

In this resource, a special kind of functional relationship is explored: the proportional relationship. Teachers may find the resource useful for professional development, especially the videos. Students develop proportional reasoning skills by comparing quantities, looking at the relative ways numbers change, and thinking about proportional relationships in linear functions.
This resource has four objectives. Students learn to differentiate between relative and absolute meanings of "more" and determine which of these is a proportional relationship, compare ratios without using common denominator algorithms, differentiate between additive and multiplicative processes and their effects on scale and proportionality, and interpret graphs that represent proportional relationships or direct variation.

Type: Unit/Lesson Sequence

Direct and Inverse Variation:

"Lesson 1 of two lessons teaches students about direct variation by allowing them to explore a simulated oil spill using toilet paper tissues (to represent land) and drops of vegetable oil (to simulate a volume of oil). Lesson 2 teaches students about inverse variation by exploring the relationship between the heights of a fixed amount of water poured into cylindrical containers of different sizes as compared to the area of the containers' bases." from Insights into Algebra 1 - Annenberg Foundation.

Type: Unit/Lesson Sequence

Video/Audio/Animation

Slope:

"Slope" is a fundamental concept in mathematics. Slope of a linear function is often defined as " the rise over the run"....but why?

Type: Video/Audio/Animation

Virtual Manipulative

Graphing Lines:

This manipulative will help you to explore the world of lines. You can investigate the relationships between linear equations, slope, and graphs of lines.

Type: Virtual Manipulative

MFAS Formative Assessments

Compare Slopes:

Students are asked to identify, describe and compare the slopes of two proportional relationships given the graph of one and the equation of the other.

Interpreting Slope:

Students are asked to graph a proportional relationship, given a table of values, and find and interpret the slope.

Proportional Paint:

Students are given a graph of a proportional relationship and asked to determine the unit rate of the relationship and compare it to the slope of the graph.

Student Resources

Vetted resources students can use to learn the concepts and skills in this benchmark.

Problem-Solving Tasks

DVD Profits, Variation 1:

In this task, students are asked to determine the unit price of a product under two different circumstances. They are also asked to generalize the cost of producing x items in each case.

Type: Problem-Solving Task

Who Has the Best Job?:

This task asks the student to graph and compare two proportional relationships and interpret the unit rate as the slope of the graph. Students are also asked to write an equation and graph each scenario.

Type: Problem-Solving Task

Coffee by the Pound:

Students will answer questions about unit price of coffee, make a graph of the information, and explain the meaning of constant of proportionality/slope in the given context.

Type: Problem-Solving Task

Comparing Speeds in Graphs and Equations:

This task provides the opportunity for students to reason about graphs, slopes, and rates without having a scale on the axes or an equation to represent the graphs. Students who prefer to work with specific numbers can write in scales on the axes to help them get started.

Type: Problem-Solving Task

Peaches and Plums:

This task asks students to reason about the relative costs per pound of two fruits without actually knowing what the costs are. Students who find this difficult may add a scale to the graph and reason about the meanings of the ordered pairs. Comparing the two approaches in a class discussion can be a profitable way to help students make sense of slope.

Type: Problem-Solving Task

Equations of Lines:

This task asks the student to understand the relationship between slope and changes in x- and y-values of a linear function.

Type: Problem-Solving Task

Find the Change:

This activity challenges students to recognize the relationship between slope and the difference in x- and y-values of a linear function. Help students solidify their understanding of linear functions and push them to be more fluent in their reasoning about slope and y-intercepts. This task has also produced a reasonable starting place for discussing point-slope form of a linear equation.

Type: Problem-Solving Task

Student Center Activity

Edcite: Mathematics Grade 8:

Students can practice answering mathematics questions on a variety of topics. With an account, students can save their work and send it to their teacher when complete.

Type: Student Center Activity

Tutorial

Linear Equations:

This tutorial will help you to explore slopes of lines and see how slope is represented on the x-y axes.

Type: Tutorial

Video/Audio/Animation

Slope:

"Slope" is a fundamental concept in mathematics. Slope of a linear function is often defined as " the rise over the run"....but why?

Type: Video/Audio/Animation

Parent Resources

Vetted resources caregivers can use to help students learn the concepts and skills in this benchmark.

Problem-Solving Tasks

DVD Profits, Variation 1:

In this task, students are asked to determine the unit price of a product under two different circumstances. They are also asked to generalize the cost of producing x items in each case.

Type: Problem-Solving Task

Sore Throats, Variation 2:

Students graph proportional relationships and understand the unit rate as a measure of the steepness of the related line, called the slope. Students will also treat slopes more formally when they graph proportional relationships and interpret the unit rate as the slope of the graph.

Type: Problem-Solving Task

Who Has the Best Job?:

This task asks the student to graph and compare two proportional relationships and interpret the unit rate as the slope of the graph. Students are also asked to write an equation and graph each scenario.

Type: Problem-Solving Task

Coffee by the Pound:

Students will answer questions about unit price of coffee, make a graph of the information, and explain the meaning of constant of proportionality/slope in the given context.

Type: Problem-Solving Task

Comparing Speeds in Graphs and Equations:

This task provides the opportunity for students to reason about graphs, slopes, and rates without having a scale on the axes or an equation to represent the graphs. Students who prefer to work with specific numbers can write in scales on the axes to help them get started.

Type: Problem-Solving Task

Peaches and Plums:

This task asks students to reason about the relative costs per pound of two fruits without actually knowing what the costs are. Students who find this difficult may add a scale to the graph and reason about the meanings of the ordered pairs. Comparing the two approaches in a class discussion can be a profitable way to help students make sense of slope.

Type: Problem-Solving Task

Equations of Lines:

This task asks the student to understand the relationship between slope and changes in x- and y-values of a linear function.

Type: Problem-Solving Task

Find the Change:

This activity challenges students to recognize the relationship between slope and the difference in x- and y-values of a linear function. Help students solidify their understanding of linear functions and push them to be more fluent in their reasoning about slope and y-intercepts. This task has also produced a reasonable starting place for discussing point-slope form of a linear equation.

Type: Problem-Solving Task