MAFS.7.SP.3.7Archived Standard

Develop a probability model and use it to find probabilities of events. Compare probabilities from a model to observed frequencies; if the agreement is not good, explain possible sources of the discrepancy.
  1. Develop a uniform probability model by assigning equal probability to all outcomes, and use the model to determine probabilities of events. For example, if a student is selected at random from a class, find the probability that Jane will be selected and the probability that a girl will be selected.
  2. Develop a probability model (which may not be uniform) by observing frequencies in data generated from a chance process. For example, find the approximate probability that a spinning penny will land heads up or that a tossed paper cup will land open-end down. Do the outcomes for the spinning penny appear to be equally likely based on the observed frequencies?
General Information
Subject Area: Mathematics
Grade: 7
Domain-Subdomain: Statistics & Probability
Cluster: Level 3: Strategic Thinking & Complex Reasoning
Cluster: Investigate chance processes and develop, use, and evaluate probability models. (Supporting Cluster) -

Clusters should not be sorted from Major to Supporting and then taught in that order. To do so would strip the coherence of the mathematical ideas and miss the opportunity to enhance the major work of the grade with the supporting clusters.

Date Adopted or Revised: 02/14
Date of Last Rating: 02/14
Status: State Board Approved - Archived
Assessed: Yes
Test Item Specifications
    Also Assesses:
     MAFS.7.SP.3.8 Find probabilities of compound events using organized lists, tables, tree diagrams, and simulation.

    MAFS.7.SP.3.8a Understand that, just as with simple events, the probability of a compound event is the fraction of outcomes in the sample space for which the compound event occurs.

    MAFS.7.SP.3.8b Represent sample spaces for compound events using methods such as organized lists, tables, and tree diagrams. For an event described in everyday language (e.g., “rolling double sixes”), identify the outcomes in the sample space which compose the event.

    MAFS.7.SP.3.8c Design and use a simulation to generate frequencies for compound events. For example, use random digits as a simulation tool to approximate the answer to the question: If 40% of donors have type A blood, what is the probability that it will take at least 4 donors to find one with type A blood?

  • Assessment Limits :

    N/A

  • Calculator :

    Neutral

  • Context :

    Required

Sample Test Items (6)
  • Test Item #: Sample Item 1
  • Question: A bag contains 3 red marbles and 6 blue marbles. 

    What is the probability of randomly selecting a red marble from the bag?

  • Difficulty: N/A
  • Type: EE: Equation Editor

  • Test Item #: Sample Item 2
  • Question: Tony has a bucket filled with 10 green, 3 blue, 1 red, and 7 yellow tennis balls. He removes 4 tennis balls from the bucket, without replacement. 

    Which of the following outcomes could represent this selection?


  • Difficulty: N/A
  • Type: MS: Multiselect

  • Test Item #: Sample Item 3
  • Question: Select all situations that describe a probability of begin mathsize 12px style 1 over 6 end style of drawing a red marble out of the bag.


  • Difficulty: N/A
  • Type: MS: Multiselect

  • Test Item #: Sample Item 4
  • Question: A bucket contains 5 green tennis balls and 2 yellow tennis balls. Tony removes 2 tennis balls, with replacement, from the bucket shown. 

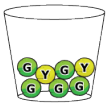
    What is the probability that Tony will choose a yellow tennis ball and then a green tennis ball?


  • Difficulty: N/A
  • Type: EE: Equation Editor

  • Test Item #: Sample Item 5
  • Question: A bucket contains 5 green tennis balls, 2 yellow tennis balls, and 6 red tennis balls. Tony removes 3 tennis balls, with replacement, from the bucket shown.

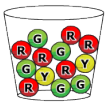
    What is the probability that the first tennis ball is yellow, the second tennis ball is green, and the third tennis ball is red?

  • Difficulty: N/A
  • Type: EE: Equation Editor

  • Test Item #: Sample Item 6
  • Question:

    A bag contains 4 red, 4 blue, 4 green, and 4 yellow marbles. A marble is randomly pulled from the bag and replaced seven times. The table shows the outcome of the experiment.

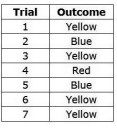
    Which marble color's observed frequency is closest to its expected frequency?


  • Difficulty: N/A
  • Type: MC: Multiple Choice

Related Courses

This benchmark is part of these courses.
1205040: M/J Grade 7 Mathematics (Specifically in versions: 2014 - 2015, 2015 - 2022, 2022 and beyond (current))
1205050: M/J Accelerated Mathematics Grade 7 (Specifically in versions: 2014 - 2015, 2015 - 2020, 2020 - 2022, 2022 and beyond (current))
1204000: M/J Foundational Skills in Mathematics 6-8 (Specifically in versions: 2014 - 2015, 2015 - 2022, 2022 and beyond (current))
7812020: Access M/J Grade 7 Mathematics (Specifically in versions: 2014 - 2015, 2015 - 2018, 2018 - 2019, 2019 - 2022, 2022 and beyond (current))

Related Access Points

Alternate version of this benchmark for students with significant cognitive disabilities.

Related Resources

Vetted resources educators can use to teach the concepts and skills in this benchmark.

Formative Assessments

Marble Probability:

Students are asked to determine probabilities based on observed outcomes and to determine if the outcomes appear to be equally likely.

Type: Formative Assessment

Number Cube:

Students are asked to determine probabilities based on observed outcomes and to determine if the outcomes appear to be equally likely.

Type: Formative Assessment

Technical Difficulties:

Students are given a scenario and asked to determine the probability of two different events.

Type: Formative Assessment

Errand Runner:

Students are asked to determine the probability of a chance event and explain possible causes for the difference between the probability and observed frequencies.

Type: Formative Assessment

Image/Photograph

Clipart ETC: Probability:

Clipart images that relate to probability.

Type: Image/Photograph

Lesson Plans

Water, Water Everywhere - Natural Disaster Water Filtration:

Students will be tasked with an engineering challenge to design an effective and efficient portable water filtration system. The designs will take dirty water and make it clear so it can be boiled for safe drinking. This lesson aligns to both math and science content standards.

Type: Lesson Plan

3D Printing: Designing Robots Using Heredity and Probability:

This lesson explores the importance of Punnett squares in determining genetic characteristics. It uses a 3D printer to demonstrate these characteristics.

Type: Lesson Plan

Genetics Has Gone to the Dogs!:

This lesson uses pooches to teach about pedigrees and the impact of artificial selection on individuals and populations as well as to drive home math concepts already discussed in lessons on Punnet squares.

Type: Lesson Plan

Hair or No Hair- Please tell me Punnett Square:

This lesson is designed to teach students how to read and interpret Punnett square with the final goal of them creating their own squares. The students will be able to determine possible genotypes and phenotypes of offspring based parent alleles.

Type: Lesson Plan

Pick and Roll:

This lesson is designed to teach students about independent and dependent compound probability and give students opportunities to experiment with probabilities through the use of manipulatives, games, and a simulation project. The lesson can take as long as three hours (classes), but can be modified to fit within two hours (classes).

Type: Lesson Plan

Probability:

This lesson is designed to develop students' understanding of probability in real life situations. Students will also be introduced to running experiments, experimental probability, and theoretical probability. This lesson provides links to discussions and activities related to probability as well as suggested ways to integrate them into the lesson. Finally, the lesson provides links to follow-up lessons designed for use in succession with the current one.

Type: Lesson Plan

A Roll of the Dice:

What are your chances of tossing a particular number on a number cube? Students collect data by experimenting and then converting the data in terms of probability. By the end of the lesson, students should have a basic understanding of simple events.

Type: Lesson Plan

Perspectives Video: Experts

How Math Models Help Insurance Companies After a Hurricane Hits:

Hurricanes can hit at any time! How do insurance companies use math and weather data to help to restore the community?

Download the CPALMS Perspectives video student note taking guide.

Type: Perspectives Video: Expert

Probabilistic Weather Modeling:

Meteorologist from Risk Management discusses the use of probability in predicting hurricane tracks.

Download the CPALMS Perspectives video student note taking guide.

Type: Perspectives Video: Expert

Let's Make a Math Deal:

Should I keep my choice or switch? Learn more about the origins and probability behind the Monty Hall door picking dilemma and how Game Theory and strategy effect the probability.

Download the CPALMS Perspectives video student note taking guide.

Type: Perspectives Video: Expert

History of Probability and the Problem of Points:

What was the first question that started probability theory?

Download the CPALMS Perspectives video student note taking guide.

Type: Perspectives Video: Expert

Problem-Solving Tasks

How Many Buttons?:

This resource involves a simple data-gathering activity which furnishes data that students organize into a table. They are then asked to refer to the data and determine the probability of various outcomes.

Type: Problem-Solving Task

Rolling Dice:

This task is intended as a classroom activity. Students pool the results of many repetitions of the random phenomenon (rolling dice) and compare their results to the theoretical expectation they develop by considering all possible outcomes of rolling two dice. This gives them a concrete example of what we mean by long term relative frequency.

Type: Problem-Solving Task

Tutorials

Finding Probability:

This video demonstrates several examples of finding probability of random events.

Type: Tutorial

Comparing Theoretical to Experimental Probabilites:

This video compares theoretical and experimantal probabilities and sources of possible discrepancy.

Type: Tutorial

Finding Probability of a Simple Event:

This video demonstrates how to find the probability of a simple event.

Type: Tutorial

Video/Audio/Animation

Probability Explained:

This 8-minute video provides an introduction to the concept of probability through the example of flipping a coin and rolling a die.

Type: Video/Audio/Animation

Virtual Manipulatives

Spinner:

In this activity, students adjust how many sections there are on a fair spinner then run simulated trials on that spinner as a way to develop concepts of probability. A table next to the spinner displays the theoretical probability for each color section of the spinner and records the experimental probability from the spinning trials. This activity allows students to explore the topics of experimental and theoretical probability by seeing them displayed side by side for the spinner they have created. This activity includes supplemental materials, including background information about the topics covered, a description of how to use the application, and exploration questions for use with the java applet.

Type: Virtual Manipulative

Interactive Marbles:

This online manipulative allows the student to simulate placing marbles into a bag and finding the probability of pulling out certain combinations of marbles. This allows exploration of probabilities of multiple events as well as probability with and without replacement. The tabs above the applet provide access to supplemental materials, including background information about the topics covered, a description of how to use the application, and exploration questions for use with the Java applet.

Type: Virtual Manipulative

Plinko Probability:

The students will play a classic game from a popular show. Through this they can explore the probability that the ball will land on each of the numbers and discover that more accurate results coming from repeated testing. The simulation can be adjusted to influence fairness and randomness of the results.

Type: Virtual Manipulative

MFAS Formative Assessments

Errand Runner:

Students are asked to determine the probability of a chance event and explain possible causes for the difference between the probability and observed frequencies.

Marble Probability:

Students are asked to determine probabilities based on observed outcomes and to determine if the outcomes appear to be equally likely.

Number Cube:

Students are asked to determine probabilities based on observed outcomes and to determine if the outcomes appear to be equally likely.

Technical Difficulties:

Students are given a scenario and asked to determine the probability of two different events.

Student Resources

Vetted resources students can use to learn the concepts and skills in this benchmark.

Problem-Solving Tasks

How Many Buttons?:

This resource involves a simple data-gathering activity which furnishes data that students organize into a table. They are then asked to refer to the data and determine the probability of various outcomes.

Type: Problem-Solving Task

Rolling Dice:

This task is intended as a classroom activity. Students pool the results of many repetitions of the random phenomenon (rolling dice) and compare their results to the theoretical expectation they develop by considering all possible outcomes of rolling two dice. This gives them a concrete example of what we mean by long term relative frequency.

Type: Problem-Solving Task

Tutorials

Finding Probability:

This video demonstrates several examples of finding probability of random events.

Type: Tutorial

Comparing Theoretical to Experimental Probabilites:

This video compares theoretical and experimantal probabilities and sources of possible discrepancy.

Type: Tutorial

Finding Probability of a Simple Event:

This video demonstrates how to find the probability of a simple event.

Type: Tutorial

Video/Audio/Animation

Probability Explained:

This 8-minute video provides an introduction to the concept of probability through the example of flipping a coin and rolling a die.

Type: Video/Audio/Animation

Virtual Manipulatives

Spinner:

In this activity, students adjust how many sections there are on a fair spinner then run simulated trials on that spinner as a way to develop concepts of probability. A table next to the spinner displays the theoretical probability for each color section of the spinner and records the experimental probability from the spinning trials. This activity allows students to explore the topics of experimental and theoretical probability by seeing them displayed side by side for the spinner they have created. This activity includes supplemental materials, including background information about the topics covered, a description of how to use the application, and exploration questions for use with the java applet.

Type: Virtual Manipulative

Interactive Marbles:

This online manipulative allows the student to simulate placing marbles into a bag and finding the probability of pulling out certain combinations of marbles. This allows exploration of probabilities of multiple events as well as probability with and without replacement. The tabs above the applet provide access to supplemental materials, including background information about the topics covered, a description of how to use the application, and exploration questions for use with the Java applet.

Type: Virtual Manipulative

Plinko Probability:

The students will play a classic game from a popular show. Through this they can explore the probability that the ball will land on each of the numbers and discover that more accurate results coming from repeated testing. The simulation can be adjusted to influence fairness and randomness of the results.

Type: Virtual Manipulative

Parent Resources

Vetted resources caregivers can use to help students learn the concepts and skills in this benchmark.

Problem-Solving Tasks

How Many Buttons?:

This resource involves a simple data-gathering activity which furnishes data that students organize into a table. They are then asked to refer to the data and determine the probability of various outcomes.

Type: Problem-Solving Task

Rolling Dice:

This task is intended as a classroom activity. Students pool the results of many repetitions of the random phenomenon (rolling dice) and compare their results to the theoretical expectation they develop by considering all possible outcomes of rolling two dice. This gives them a concrete example of what we mean by long term relative frequency.

Type: Problem-Solving Task