
General Information
Clusters should not be sorted from Major to Supporting and then taught in that order. To do so would strip the coherence of the mathematical ideas and miss the opportunity to enhance the major work of the grade with the supporting clusters.
Test Item Specifications
- Interpret distance-time graphs as if they are pictures of situations rather than abstract representations of them.
- Have difficulty relating speeds to slopes of these graphs.
- Interpret speed as the slope of a linear graph.
- Translate between the equation of a line and its graphical representation.
- In Lesson 1 students use mathematical models (tables and equations) to represent the relationship between the number of revolutions made by a "driver" and a "follower" (two connected gears in a system), and they will explain the significance of the radii of the gears in regard to this relationship.
- In Lesson 2 students mathematically model the growth of populations and use exponential functions to represent that growth.
Function notation may not be used. Functions must be linear.
Neutral
Allowable
Sample Test Items (3)
| Test Item # | Question | Difficulty | Type |
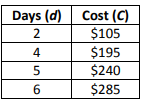
| Sample Item 1 | The cost, C, to rent a car for d days is shown in the table.
Write an equation that represents this function? |
N/A | EE: Equation Editor |
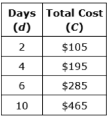
| Sample Item 2 | A rental car company has a linear pricing plan. The total cost, C, to rent a car for 2, 4, 6, and 10 days, d, is shown.
A. What is the daily rate for the pricing plan? B. Write an equation that represents the pricing plan. |
N/A | EE: Equation Editor |
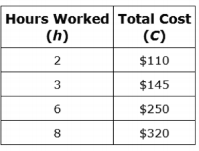
| Sample Item 3 | This question has two parts. Suzie's Plumbing uses a linear model to determine the total cost, in dollars, of a service call. Part A. Using the table below, create an equation to represent the linear model that Suzie's Plumbing uses to determine the total cost, C, in terms of hours worked, h.
Part B. Select the phrases and values to make accurate statements about the service fee and the hourly charge. The one-time fee is represented by the ___________ of the function and is ____. The hourly charge is represented by the _______ of the function and is _____ per hour. |
N/A | : Multiple Types |
Related Courses
| Course Number1111 | Course Title222 |
| 1205050: | M/J Accelerated Mathematics Grade 7 (Specifically in versions: 2014 - 2015, 2015 - 2020, 2020 - 2022, 2022 and beyond (current)) |
| 1205070: | M/J Grade 8 Pre-Algebra (Specifically in versions: 2014 - 2015, 2015 - 2022, 2022 and beyond (current)) |
| 1204000: | M/J Foundational Skills in Mathematics 6-8 (Specifically in versions: 2014 - 2015, 2015 - 2022, 2022 and beyond (current)) |
| 1200410: | Mathematics for College Success (Specifically in versions: 2014 - 2015, 2015 - 2022 (course terminated)) |
| 1200700: | Mathematics for College Algebra (Specifically in versions: 2014 - 2015, 2015 - 2022 (course terminated)) |
| 7812030: | Access M/J Grade 8 Pre-Algebra (Specifically in versions: 2014 - 2015, 2015 - 2018, 2018 - 2019, 2019 - 2022, 2022 and beyond (current)) |
Related Resources
3D Modeling
| Name | Description |
| Wind Farm Design Challenge | In this engineering design challenge, students are asked to create the most efficient wind turbine while balancing cost constraints. Students will apply their knowledge of surface area and graphing while testing 3D-printed wind farm blades. In the end, students are challenged to design and test their own wind farm blades, using Tinkercad to model a 3D-printable blade. |
Formative Assessments
| Name | Description |
| Profitable Functions | Students are asked to write a function to model a linear relationship given its graph. |
| Trekking Functions | Students are asked to construct a function to model a linear relationship between two quantities given a table of values. |
| Smart TV | Students are asked to determine the rate of change and initial value of a linear function given a table of values, and interpret the rate of change and initial value in terms of the situation it models. |
| Construction Function | Students are asked to construct a function to model a linear relationship between two quantities given two ordered pairs in context. |
| Drain the Pool | Students are asked to determine the rate of change and initial value of a linear function when given a graph, and to interpret the rate of change and initial value in terms of the situation it models. |
| Interpreting Distance-Time Graphs | This lesson unit is intended to help you assess how well students are able to interpret distance-time graphs and, in particular, to help you identify students who:
|
| Lines and Linear Equations | This lesson is intended to help you assess how well students are able to: |
Lesson Plans
| Name | Description |
| Rockets To Pluto | Students will explore current space technology and explore the possibilities of traveling to Pluto. Students will participate in an Engineering Design Challenge in which they will construct and test their rockets to see how far they can go! An Engineering Design Challenge is a combination of project-based learning, design thinking, and the engineering design process that develops the innovator's mindset through iteration. This lets students use their own imaginations to design projects according to science and engineering processes. |
| Fast Food Frenzy | In this activity, students will engage critically with nutritional information and macronutrient content of several fast food meals. This is an MEA that requires students to build on prior knowledge of nutrition and working with percentages. Model Eliciting Activities, MEAs, are open-ended, interdisciplinary problem-solving activities that are meant to reveal students’ thinking about the concepts embedded in realistic situations. Click here to learn more about MEAs and how they can transform your classroom. |
| What's My Function? | Students will determine function rules that have been written on cards taped to their backs. They will suggest input values and peers will provide output values to help them determine their function. They will then graph their functions for additional practice. |
| Lines and Linear Equations | This lesson unit is intended to help you assess how well students are able to interpret speed as the slope of a linear graph and translate between the equation of a line and its graphical representation. |
| Interpreting Distance-Time Graphs | This lesson takes a formative assessment approach to assessing whether students can interpret distance-time graphs. Whole-class discussion, group work, and individual activities help students interpret distance-time graphs related to real-world scenarios. |
| Discovering Kepler's Law for the Periods of Planets | Students listen to a video that describes Kepler's determination that planetary orbits are elliptical and then will use data for the solar distance and periods of several of the planets in the solar system, then investigate several hypotheses to determine which is supported by the data. |
| Getting Graphic with Linear Functions | Students will learn how to construct a linear function to model a linear relationship, determine the rates of change and initial value from a table and graph as well as be able to interpret what the rate of change means as it relates to a situation. |
| In the Real World | This resource provides a Lesson Plan for teaching students how to analyze word problems to look for clearly identified values and determine which of them is a constant value and which of them is subject to change (will increase or decrease per unit of time, weight, length, etc.). The students will also be taught how to determine the correct units for each value in the equation. |
| Are We There Yet? | Students will learn to write and interpret linear functions that represent real world situations, noting the importance of slope and y-intercept. |
Original Student Tutorials
| Name | Description |
| Constructing Functions From Two Points | Learn to construct a function to model a linear relationship between two quantities and determine the slope and y-intercept given two points that represent the function with this interactive tutorial. |
| Scatterplots Part 5: Interpreting the Equation of the Trend Line | Explore how to interpret the slope and y-intercept of a linear trend line when bivariate data is graphed on a scatterplot in this interactive tutorial. This is part 5 in 6-part series. Click below to open the other tutorials in the series. |
| Scatterplots Part 4: Equation of the Trend Line | Learn how to write the equation of a linear trend line when fitted to bivariate data in a scatterplot in this interactive tutorial. This is part 4 in 6-part series. Click below to open the other tutorials in the series. |
| Constructing Linear Functions from Tables | Learn to construct linear functions from tables that contain sets of data that relate to each other in special ways as you complete this interactive tutorial. |
Perspectives Video: Professional/Enthusiast
| Name | Description |
| Slope and Deep Sea Sharks | Shark researcher, Chip Cotton, discusses the use of regression lines, slope, and determining the strength of the models he uses in his research. Download the CPALMS Perspectives video student note taking guide. |
Problem-Solving Tasks
| Name | Description |
| High School Graduation | This task provides a unique application of modeling with mathematics. Also, students often think that time must always be the independent variable and so may need some help understanding that one chooses the independent and dependent variable based on the way one wants to view a situation. |
| Baseball Cards | This task could be put to good use in an instructional sequence designed to develop knowledge related to students' understanding of linear functions in contexts. Though students could work independently on the task, collaboration with peers is more likely to result in the exploration of a range of interpretations. |
| Modeling with a Linear Function | The primary purpose of this task is to elicit common misconceptions that arise when students try to model situations with linear functions. This task, being multiple choice, could also serve as a quick assessment to gauge a class' understanding of modeling with linear functions. |
| Downhill | This task would be especially well-suited for instructional purposes. Students will benefit from a class discussion about the slope, y-intercept, x-intercept, and implications of the restricted domain for interpreting more precisely what the equation is modeling. |
| Chicken and Steak, Variation 1 | In this problem-solving task students are challenged to apply their understanding of linear relationships to determine the amount of chicken and steak needed for a barbecue, which will include creating an equation, sketching a graph, and interpreting both. This resource also includes annotated solutions. |
| Video Streaming | Construct a function to model a linear relationship between two quantities. Determine the rate of change and initial value of the function from a description of a relationship or from two (x,y) values, including reading these from a table or from a graph. Interpret the rate of change and initial value of a linear function in terms of the situation it models, and in terms of its graph or a table of values. |
| Chicken and Steak, Variation 2 | In this problem-solving task students are challenged to apply their understanding of linear relationships to determine the amount of chicken and steak needed for a barbecue, which will include creating an equation, sketching a graph, and interpreting both. This resource also includes annotated solutions. |
| Delivering the Mail | This problem-solving task involves constructing a linear function and interpreting its parameters in a mail delivery context. It includes annotated solutions. |
| Distance Across the Channel | This problem-solving task asks students to find a linear function that models something in the real world. After finding the equation of the linear relationship between the depth of the water and the distance across the channel, students have to verbalize the meaning of the slope and intercept of the line in the context of this situation. Commentary and illustrated solutions are included. |
| Drip, Drop, Drip, Drop | Students design an experiment to model a leaky faucet and determine the amount of water wasted due to the leak. Using the data they gather in a table, students graph and write an equation for a line of best fit. Students then use their derived equation to make predictions about the amount of water that would be wasted from one leak over a long period of time or the amount wasted by several leaks during a specific time period. |
Professional Development
| Name | Description |
| Mathematical Modeling: Insights into Algebra, Teaching for Learning | This professional development resource provides a rich collection of information to help teachers engage students more effectively in mathematical modeling. It features videos of two complete lessons with commentary, background information on effective teaching, modeling, and lesson study, full lesson plans to teach both example lessons, examples of student work from the lessons, tips for effective teaching strategies, and list of helpful resources. |
Student Center Activity
| Name | Description |
| Edcite: Mathematics Grade 8 | Students can practice answering mathematics questions on a variety of topics. With an account, students can save their work and send it to their teacher when complete. |
Teaching Idea
| Name | Description |
| Learning About Rate of Change in Linear Functions Using Interactive Graphs | This resource features two pairs of interactive graphs to help students explore rate of change and linear relationships. "Users can drag a slider on an interactive graph to modify a rate of change (cost per minute for phone use) and learn how modifications in that rate affect the linear graph displaying accumulation (the total cost of calls). In this first part, Constant Cost per Minute, the cost per minute for phone use remains constant over time. In the second part, Changing Cost per Minute, the cost per minute for phone use changes after the first sixty minutes of calls." (from NCTM's Illuminations) |
Tutorials
| Name | Description |
| Finding and Interpreting Slope from a Table | In this video, you will practice finding the slope of a line from data in a table, and interpret what the slope means in the problem. |
| Interpreting Linear Graphs: Cats, Cats and More Cats! | In this video, you will use a linear graph to determine the y-intercept (starting point) and slope (rate of change), as well as interpret what these mean in the given scenario. |
| Slope-Intercept Form from a Table | In this video, you will practice writing the slope-intercept form for a line, given a table of x and y values. |
| Slope-Intercept Equation from Two Solutions | Given two points on a line, you will find the slope and the y-intercept. You will then write the equation of the line in slope-intercept form. |
| Slope-Intercept Equation from Slope and Point | Given the slope of a line and a point on the line, you will write the equation of the line in slope-intercept form. |
| Determining a linear equation by checking solutions | Students will learn how to determine an equation by checking solutions. Students will be given a table and 4 linear equations and they will have to determine which equation created the table. |
| Using the Slope-Intercept Form of a Line | In this video, you will practice writing the equations of lines in slope-intercept form from graphs. You will then practice graphing lines from equations in slope-intercept form. |
| Dependent and Independent Variables Exercise: Express the Graph as an Equation | Given a graph, we will be able to find the equation it represents. |
Unit/Lesson Sequences
| Name | Description |
| Linear Functions and Slope | This session on linear function and slope contains five parts, multiple problems and videos, and interactive activities geared to help students recognize and understand linear relationships, explore slope and dependent and independent variables in graphs of linear relationships, and develop an understanding of rates and how they are related to slopes and equations. Throughout the session, students use spreadsheets to complete the work, and are encouraged to think about the ways technology can aid in teaching and understanding. The solutions for all problems are given, and many allow students to have a hint or tip as they solve. There is even a homework assignment with four problems for students after they have finished all five parts of the session. |
| Proportional Reasoning | In this resource, a special kind of functional relationship is explored: the proportional relationship. Teachers may find the resource useful for professional development, especially the videos. Students develop proportional reasoning skills by comparing quantities, looking at the relative ways numbers change, and thinking about proportional relationships in linear functions.
This resource has four objectives. Students learn to differentiate between relative and absolute meanings of "more" and determine which of these is a proportional relationship, compare ratios without using common denominator algorithms, differentiate between additive and multiplicative processes and their effects on scale and proportionality, and interpret graphs that represent proportional relationships or direct variation. |
| Direct and Inverse Variation | "Lesson 1 of two lessons teaches students about direct variation by allowing them to explore a simulated oil spill using toilet paper tissues (to represent land) and drops of vegetable oil (to simulate a volume of oil). Lesson 2 teaches students about inverse variation by exploring the relationship between the heights of a fixed amount of water poured into cylindrical containers of different sizes as compared to the area of the containers' bases." from Insights into Algebra 1 - Annenberg Foundation. |
Virtual Manipulatives
| Name | Description |
| Linear Equations | This resource provides guided practice for writing and graphing linear functions. |
| Linear Function Machine | In this activity, students plug values into the independent variable to see what the output is for that function. Then based on that information, they have to determine the coefficient (slope) and constant(y-intercept) for the linear function. This activity allows students to explore linear functions and what input values are useful in determining the linear function rule. This activity includes supplemental materials, including background information about the topics covered, a description of how to use the application, and exploration questions for use with the Java applet. |
| Graphing Lines | Allows students access to a Cartesian Coordinate System where linear equations can be graphed and details of the line and the slope can be observed. |
| Function Flyer | In this online tool, students input a function to create a graph where the constants, coefficients, and exponents can be adjusted by slider bars. This tool allows students to explore graphs of functions and how adjusting the numbers in the function affect the graph. Using tabs at the top of the page you can also access supplemental materials, including background information about the topics covered, a description of how to use the application, and exploration questions for use with the java applet. |
| Number Cruncher | In this activity, students enter inputs into a function machine. Then, by examining the outputs, they must determine what function the machine is performing. This activity allows students to explore functions and what inputs are most useful for determining the function rule. This activity includes supplemental materials, including background information about the topics covered, a description of how to use the application, and exploration questions for use with the java applet. |
Worksheet
| Name | Description |
| Mass vs. Weight | This laboratory activity worksheet engages students in an exploration of mass and weight. Students use a balance and spring scale to measure the masses and weights of a several of objects. Students will analyze the data and determine the the relationship between mass and weight using graphing skills. An answer key is attached to assist the use of this resource. |
Student Resources
Original Student Tutorials
| Name | Description |
| Constructing Functions From Two Points: | Learn to construct a function to model a linear relationship between two quantities and determine the slope and y-intercept given two points that represent the function with this interactive tutorial. |
| Scatterplots Part 5: Interpreting the Equation of the Trend Line : | Explore how to interpret the slope and y-intercept of a linear trend line when bivariate data is graphed on a scatterplot in this interactive tutorial. This is part 5 in 6-part series. Click below to open the other tutorials in the series. |
| Scatterplots Part 4: Equation of the Trend Line: | Learn how to write the equation of a linear trend line when fitted to bivariate data in a scatterplot in this interactive tutorial. This is part 4 in 6-part series. Click below to open the other tutorials in the series. |
| Constructing Linear Functions from Tables: | Learn to construct linear functions from tables that contain sets of data that relate to each other in special ways as you complete this interactive tutorial. |
Problem-Solving Tasks
| Name | Description |
| Modeling with a Linear Function: | The primary purpose of this task is to elicit common misconceptions that arise when students try to model situations with linear functions. This task, being multiple choice, could also serve as a quick assessment to gauge a class' understanding of modeling with linear functions. |
| Downhill: | This task would be especially well-suited for instructional purposes. Students will benefit from a class discussion about the slope, y-intercept, x-intercept, and implications of the restricted domain for interpreting more precisely what the equation is modeling. |
| Chicken and Steak, Variation 1: | In this problem-solving task students are challenged to apply their understanding of linear relationships to determine the amount of chicken and steak needed for a barbecue, which will include creating an equation, sketching a graph, and interpreting both. This resource also includes annotated solutions. |
| Video Streaming: | Construct a function to model a linear relationship between two quantities. Determine the rate of change and initial value of the function from a description of a relationship or from two (x,y) values, including reading these from a table or from a graph. Interpret the rate of change and initial value of a linear function in terms of the situation it models, and in terms of its graph or a table of values. |
| Chicken and Steak, Variation 2: | In this problem-solving task students are challenged to apply their understanding of linear relationships to determine the amount of chicken and steak needed for a barbecue, which will include creating an equation, sketching a graph, and interpreting both. This resource also includes annotated solutions. |
| Distance Across the Channel: | This problem-solving task asks students to find a linear function that models something in the real world. After finding the equation of the linear relationship between the depth of the water and the distance across the channel, students have to verbalize the meaning of the slope and intercept of the line in the context of this situation. Commentary and illustrated solutions are included. |
Student Center Activity
| Name | Description |
| Edcite: Mathematics Grade 8: | Students can practice answering mathematics questions on a variety of topics. With an account, students can save their work and send it to their teacher when complete. |
Tutorials
| Name | Description |
| Finding and Interpreting Slope from a Table: | In this video, you will practice finding the slope of a line from data in a table, and interpret what the slope means in the problem. |
| Interpreting Linear Graphs: Cats, Cats and More Cats!: | In this video, you will use a linear graph to determine the y-intercept (starting point) and slope (rate of change), as well as interpret what these mean in the given scenario. |
| Slope-Intercept Form from a Table: | In this video, you will practice writing the slope-intercept form for a line, given a table of x and y values. |
| Slope-Intercept Equation from Two Solutions: | Given two points on a line, you will find the slope and the y-intercept. You will then write the equation of the line in slope-intercept form. |
| Slope-Intercept Equation from Slope and Point: | Given the slope of a line and a point on the line, you will write the equation of the line in slope-intercept form. |
| Determining a linear equation by checking solutions: | Students will learn how to determine an equation by checking solutions. Students will be given a table and 4 linear equations and they will have to determine which equation created the table. |
| Using the Slope-Intercept Form of a Line: | In this video, you will practice writing the equations of lines in slope-intercept form from graphs. You will then practice graphing lines from equations in slope-intercept form. |
| Dependent and Independent Variables Exercise: Express the Graph as an Equation: | Given a graph, we will be able to find the equation it represents. |
Virtual Manipulatives
| Name | Description |
| Linear Function Machine: | In this activity, students plug values into the independent variable to see what the output is for that function. Then based on that information, they have to determine the coefficient (slope) and constant(y-intercept) for the linear function. This activity allows students to explore linear functions and what input values are useful in determining the linear function rule. This activity includes supplemental materials, including background information about the topics covered, a description of how to use the application, and exploration questions for use with the Java applet. |
| Graphing Lines: | Allows students access to a Cartesian Coordinate System where linear equations can be graphed and details of the line and the slope can be observed. |
| Function Flyer: | In this online tool, students input a function to create a graph where the constants, coefficients, and exponents can be adjusted by slider bars. This tool allows students to explore graphs of functions and how adjusting the numbers in the function affect the graph. Using tabs at the top of the page you can also access supplemental materials, including background information about the topics covered, a description of how to use the application, and exploration questions for use with the java applet. |
| Number Cruncher: | In this activity, students enter inputs into a function machine. Then, by examining the outputs, they must determine what function the machine is performing. This activity allows students to explore functions and what inputs are most useful for determining the function rule. This activity includes supplemental materials, including background information about the topics covered, a description of how to use the application, and exploration questions for use with the java applet. |
Parent Resources
Problem-Solving Tasks
| Name | Description |
| High School Graduation: | This task provides a unique application of modeling with mathematics. Also, students often think that time must always be the independent variable and so may need some help understanding that one chooses the independent and dependent variable based on the way one wants to view a situation. |
| Baseball Cards: | This task could be put to good use in an instructional sequence designed to develop knowledge related to students' understanding of linear functions in contexts. Though students could work independently on the task, collaboration with peers is more likely to result in the exploration of a range of interpretations. |
| Modeling with a Linear Function: | The primary purpose of this task is to elicit common misconceptions that arise when students try to model situations with linear functions. This task, being multiple choice, could also serve as a quick assessment to gauge a class' understanding of modeling with linear functions. |
| Downhill: | This task would be especially well-suited for instructional purposes. Students will benefit from a class discussion about the slope, y-intercept, x-intercept, and implications of the restricted domain for interpreting more precisely what the equation is modeling. |
| Chicken and Steak, Variation 1: | In this problem-solving task students are challenged to apply their understanding of linear relationships to determine the amount of chicken and steak needed for a barbecue, which will include creating an equation, sketching a graph, and interpreting both. This resource also includes annotated solutions. |
| Video Streaming: | Construct a function to model a linear relationship between two quantities. Determine the rate of change and initial value of the function from a description of a relationship or from two (x,y) values, including reading these from a table or from a graph. Interpret the rate of change and initial value of a linear function in terms of the situation it models, and in terms of its graph or a table of values. |
| Chicken and Steak, Variation 2: | In this problem-solving task students are challenged to apply their understanding of linear relationships to determine the amount of chicken and steak needed for a barbecue, which will include creating an equation, sketching a graph, and interpreting both. This resource also includes annotated solutions. |
| Distance Across the Channel: | This problem-solving task asks students to find a linear function that models something in the real world. After finding the equation of the linear relationship between the depth of the water and the distance across the channel, students have to verbalize the meaning of the slope and intercept of the line in the context of this situation. Commentary and illustrated solutions are included. |
Teaching Idea
| Name | Description |
| Learning About Rate of Change in Linear Functions Using Interactive Graphs: | This resource features two pairs of interactive graphs to help students explore rate of change and linear relationships. "Users can drag a slider on an interactive graph to modify a rate of change (cost per minute for phone use) and learn how modifications in that rate affect the linear graph displaying accumulation (the total cost of calls). In this first part, Constant Cost per Minute, the cost per minute for phone use remains constant over time. In the second part, Changing Cost per Minute, the cost per minute for phone use changes after the first sixty minutes of calls." (from NCTM's Illuminations) |
Virtual Manipulative
| Name | Description |
| Graphing Lines: | Allows students access to a Cartesian Coordinate System where linear equations can be graphed and details of the line and the slope can be observed. |