
 so that f(x) is a function.
 General Information
Test Item Specifications
MA.912.A.2.13 Solve real-world problems involving relations and functions.
Students will determine the domain and range of relations.
In items requiring students to determine the domain and/or range from an equation, only linear and quadratic functions may be used.
Domains and ranges may be listed as inequalities (e.g., 0 < x ≤ 60 for domain), or written as a sentence.
Items should utilize function notation, as appropriate.
Items may present relations in a variety of formats, including sets of ordered pairs, tables, graphs, and input/output models.
In items requiring students to determine the domain and/or range from a graph, only linear, quadratic, or continuous piecewise functions may be used.
Items may be set in either real-world or mathematical contexts
Multiple-choice and fill-in response items may require that students provide the least value (lower bound) or greatest value (upper bound) in the domain or range, or an endpoint of the domain or range.
Fill-in response items may have a negative answer.
Sample Test Items (2)
| Test Item # | Question | Difficulty | Type |
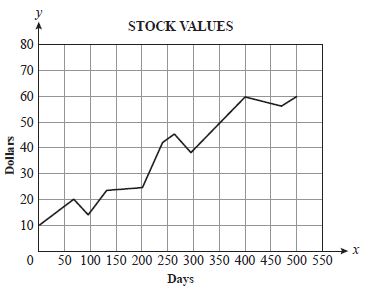
| Sample Item 1 | An economics teacher plotted the value of a stock on 11 different days during a 500-day period and used line segments to connect them. In the graph below, the horizontal axis is measured in days and the vertical axis is measured in dollars. Based on the graph, which of the following best describes the range of the value of the stock for this 500-day period? |
N/A | MC: Multiple Choice |
| Sample Item 2 | The set of ordered pairs shown below defines a relation. {(0, 0), (1, 5), (2, 8), (3, 9), (4, 8), (5, 5), (6, 0)} What is the value of the greatest element in the range of this relation? |
N/A | FR: Fill-in Response |
Related Resources
Professional Development
| Name | Description |
| Domain and Range of a Function | Khan Academy video Tutorial. Definition of domain and range. The tutorial uses six different examples to demonstrate linear, quadratic, and rational functions with consideration to the domain and range. |