


General Information
Related Benchmark: MAFS.8.SP.1.2
Reporting Category: Statistics & Probability
Type: GRID: Graphic Response Item Display
Difficulty: N/A
Question:
A scatter plot is shown.
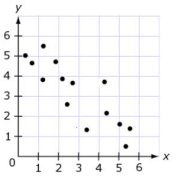
Use the Add Arrow tool to draw a line of best fit for the scatter plot.


