


General Information
Related Benchmark: MAFS.8.F.1.1
Reporting Category: Functions
Type: TI: Table Item
Difficulty: N/A
Question:
A graph of a function is shown
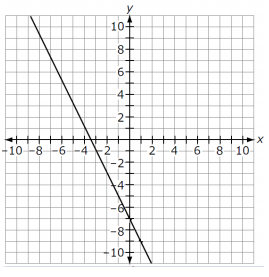
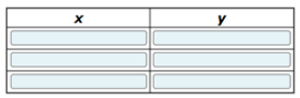
Create a table to show the relationship of the values of x to the values of y.
Answer Options:
Possible Answer:


