
General Information
Test Item Specifications
Students may extend numeric or graphic patterns beyond the next step, or find one or more missing elements in a numeric or graphic pattern.
Students will identify the rule for a pattern or the relationship between numbers.
Items may use numeric patterns, graphic patterns, function tables, or graphs (bar graphs, pictographs, or line plots only).
Numeric patterns should be shown with three or more elements.
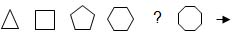
Graphic patterns should be shown with at least three examples of the pattern repeated.
Students should not be asked to extend the pattern more than three steps beyond what is given or to provide more than three missing elements.
Items will not include extending the pattern on a bar graph or pictograph.
Rules for numeric patterns and relationships shown in function tables must include only one operation limited to addition, subtraction, or multiplication. When the operation of multiplication is used, the rule is limited to the multiplication facts of 0 × 0 through 9 × 9.
Function rules or relationships may be described using words, tables, graphs, or expressions using variables or geometric shapes (e.g., n, Δ, ); however, the intent of the benchmark is not to assess solving equations.
Items may be set in either a real-world or mathematical context.
Graphics may be used in some of these items, as appropriate.
Responses that are function rules may be described using words or mathematical expressions with variables or geometric shapes (e.g., n, Δ).
Sample Test Items (1)
| Test Item # | Question | Difficulty | Type | ||||||||||
| Sample Item 1 | Allison is making lemonade for a party. The table below shows the number of lemons she will need to make several pitchers of lemonade. LEMONS NEEDED FOR LEMONADE
|
N/A | MC: Multiple Choice |
Related Resources
Educational Software / Tools
| Name | Description |
| Free Graph Paper | A variety of graph paper types for printing, including Cartesian, polar, engineering, isometric, logarithmic, hexagonal, probability, and Smith chart. |
| Hundreds Chart | A printable hundreds chart featuring a 10x10 table numbered 1 to 100. (found on Illuminations website under "Trading for Quarters") |
Lesson Plan
| Name | Description |
| The Power of Patterns | Students will work a real world problem to discover similarities and differences between the patterns of adding 2 to a number and doubling a number. The problem is set in the real world context of twin brothers who choose different patterning strategies given by their grandma to save for buying a car. |
Student Resources
Educational Software / Tool
| Name | Description |
| Hundreds Chart: | A printable hundreds chart featuring a 10x10 table numbered 1 to 100. (found on Illuminations website under "Trading for Quarters") |
Parent Resources
Educational Software / Tool
| Name | Description |
| Hundreds Chart: | A printable hundreds chart featuring a 10x10 table numbered 1 to 100. (found on Illuminations website under "Trading for Quarters") |