
General Information
Subject Area: X-Mathematics (former standards - 2008)
Grade: 912
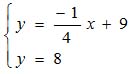
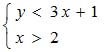
Body of Knowledge: Algebra
Standard: Linear Equations and Inequalities - Solve linear equations and inequalities.
Date Adopted or Revised: 09/07
Content Complexity Rating:
Level 2: Basic Application of Skills & Concepts
-
More Information
Date of Last Rating: 06/07
Status: State Board Approved - Archived
Assessed: Yes