General Information
Subject Area: X-Mathematics (former standards - 2008)
Grade: 912
Body of Knowledge: Algebra
Standard: Linear Equations and Inequalities - Solve linear equations and inequalities.
Date Adopted or Revised: 09/07
Content Complexity Rating:
Level 2: Basic Application of Skills & Concepts
-
More Information
Date of Last Rating: 06/07
Status: State Board Approved - Archived
Assessed: Yes
Test Item Specifications
Item Type(s):
This benchmark may be assessed using:
MC
item(s)
N/A
Clarification :
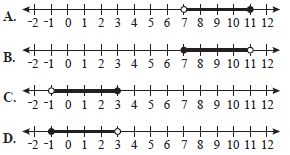
Students will solve simple and compound inequalities and graph solutions on a number line.
Students will solve simple and compound inequalities and graph solutions on a number line.
Content Limits :
Items will not include inequalities without a solution.
Items will not include inequalities without a solution.
Stimulus Attributes :
Items may be set in either real-world or mathematical contexts.
Items may be set in either real-world or mathematical contexts.
Sample Test Items (2)
| Test Item # | Question | Difficulty | Type |
| Sample Item 1 | Taylor has a total of $25 to spend on dinner, which includes a 6.5% sales tax and a 20% tip.
Taylor used the inequality shown below to calculate the amount in dollars, a, she can spend
before tax and tip.
1.2(a + 0.065a) ≤ 25 |
N/A | MC: Multiple Choice |
| Sample Item 2 | Which graph shows the solution to the inequality shown below?
|
N/A | MC: Multiple Choice |