Sample Test Item Preview


This document was generated on CPALMS - www.cpalms.org


General Information

Related Standards: MAFS.6.SP.2.4
Reporting Category: Statistics & Probability
Type: MC: Multiple Choice
Difficulty: N/A
Question:
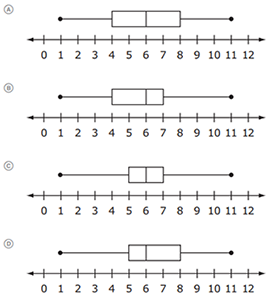
A class survey provides the data shown. 

1, 4, 4, 5, 5, 5, 6, 6, 7, 7, 7, 8, 8, 9, 11 

Which box plot represents the class?


Answer Options:

Aligned Standards

Code Description
MAFS.6.SP.2.4: Display numerical data in plots on a number line, including dot plots, histograms, and box plots.


Printed On:4/28/2024 5:21:36 AM
Print Page | Close this window