Sample Test Item Preview


This document was generated on CPALMS - www.cpalms.org


General Information

Related Standards: MAFS.6.EE.3.9
Reporting Category: Expressions & Equations
Type: SHT: Selectable Hot Text
Difficulty: N/A
Question:
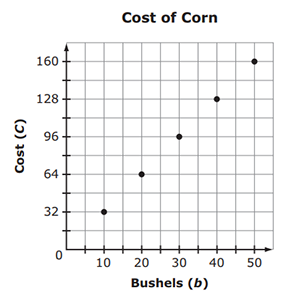
The cost per bushel of corn at Farm A is constant. The graph shows the total cost, C, in dollars, of purchasing different numbers of bushels of corn, b, at a farm.


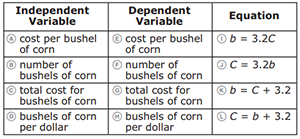
In the table below, select the phrase that represents the independent variable, the phrase that represents the dependent variable, and the equation that represents the graph.


Answer Options:

Aligned Standards

Code Description
MAFS.6.EE.3.9: Use variables to represent two quantities in a real-world problem that change in relationship to one another; write an equation to express one quantity, thought of as the dependent variable, in terms of the other quantity, thought of as the independent variable. Analyze the relationship between the dependent and independent variables using graphs and tables, and relate these to the equation. For example, in a problem involving motion at constant speed, list and graph ordered pairs of distances and times, and write the equation d = 65t to represent the relationship between distance and time.


Printed On:4/28/2024 10:47:46 PM
Print Page | Close this window