
General Information
Related Benchmarks:
MA.912.A.2.4
Reporting Category: Algebra
Type: MC: Multiple Choice
Difficulty: N/A
Question:
An economics teacher plotted the value of a stock on 11 different days during a 500-day period and used line segments to connect them. In the graph below, the horizontal axis is measured in days and the vertical axis is measured in dollars.
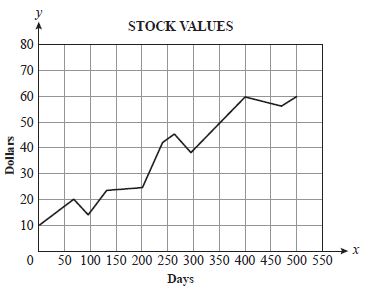
Based on the graph, which of the following best describes the range of the value of the stock for this 500-day period?
Answer Options:
A. 0 ≤ x ≤ 500
B. 1 ≤ x ≤ 500
C. 10 ≤ y ≤ 60
D. 0 ≤ y ≤ 80
B. 1 ≤ x ≤ 500
C. 10 ≤ y ≤ 60
D. 0 ≤ y ≤ 80
Answer Key:
C
Item Context:
Social Studies/Consumerism