Access Point #: MAFS.7.SP.2.AP.3a (Archived Access Point)


This document was generated on CPALMS - www.cpalms.org


Given graphed distributions of two sets of data, make statements comparing the two sets of data.

Clarifications:

Essential Understandings

Concrete:

  • Understand the concept of distribution in a data set.
  • Compare the visual of the distribution of two data sets.
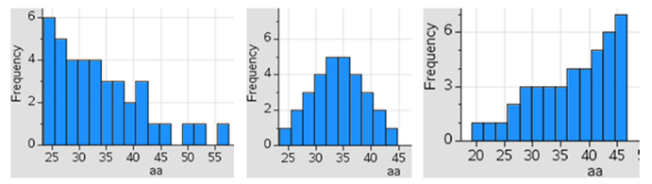
  • Match the description to the image (normal, positive skew, negative skew).

    Three different charts with data to show examples of normal, positive skew, and negative skew.
Representation:
  • Use graphs or graphic organizers to compare the measures of central tendency of two different data sets.
  • Identify the same measure of central tendency in two different data sets (e.g., the mean in one data set and the mean in another data set).

Number: MAFS.7.SP.2.AP.3a Category: Access Points
Date Adopted or Revised: 06/14 Cluster: Draw informal comparative inferences about two populations. (Additional Cluster)

Clusters should not be sorted from Major to Supporting and then taught in that order. To do so would strip the coherence of the mathematical ideas and miss the opportunity to enhance the major work of the grade with the supporting clusters.

Related Standards

Name Description
MAFS.7.SP.2.3: Informally assess the degree of visual overlap of two numerical data distributions with similar variabilities, measuring the difference between the centers by expressing it as a multiple of a measure of variability. For example, the mean height of players on the basketball team is 10 cm greater than the mean height of players on the soccer team, about twice the variability (mean absolute deviation) on either team; on a dot plot, the separation between the two distributions of heights is noticeable.


Related Courses

Name Description
1205040: M/J Grade 7 Mathematics
1205050: M/J Accelerated Mathematics Grade 7
1204000: M/J Foundational Skills in Mathematics 6-8
7812020: Access M/J Grade 7 Mathematics